Ocean freight managers need more than shipment counts to understand whether operations are improving.
A rise in bookings may look positive, but it does not show whether chargeable volume is growing, whether costs are increasing faster than activity, or whether important trade lanes are taking longer to complete.
That is why ocean freight performance should be reviewed through a combination of operational, cost, volume, and transit-time KPIs.
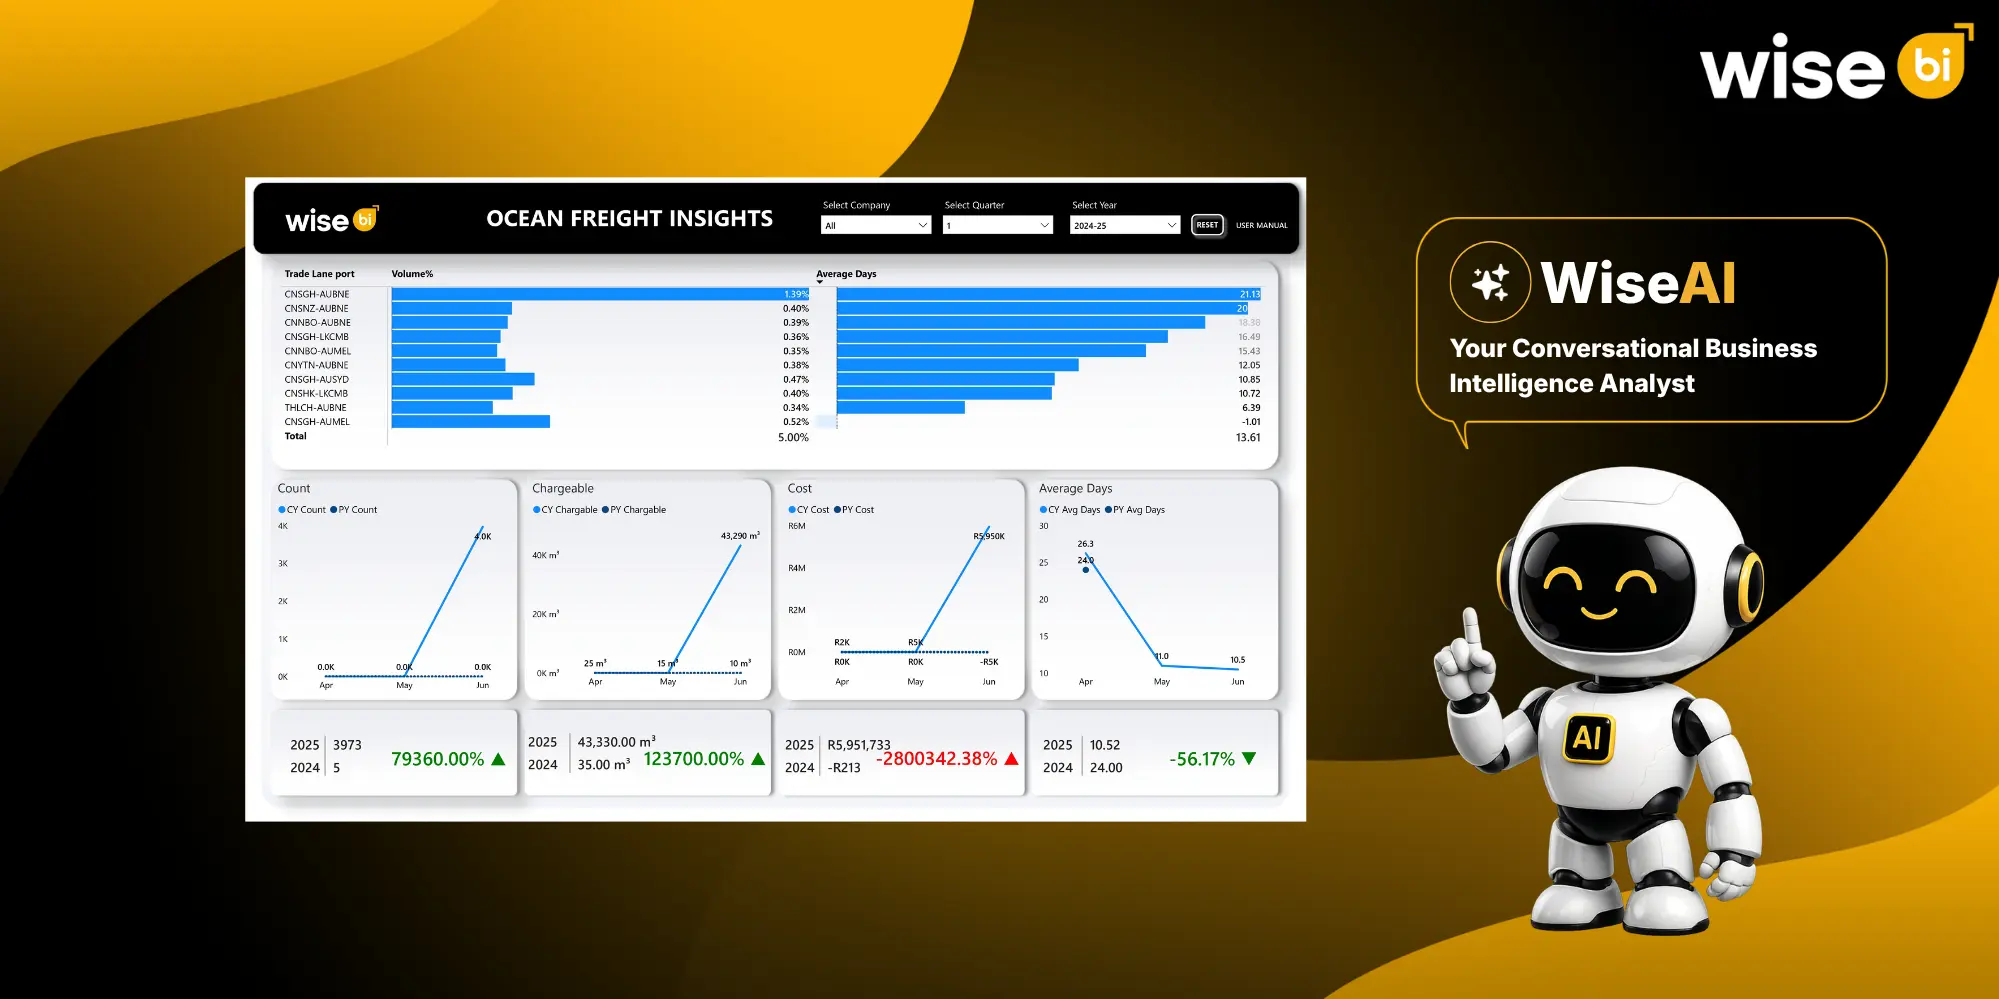
WiseBI’s CargoWise ocean freight BI dashboard combines these metrics into a single reporting view. It enables freight forwarders to compare current and previous performance, identify trade-lane changes, track cost movement, and determine whether increased activity produces better operational results.
Ocean Freight Shipment Count
Shipment count shows how many ocean freight movements your business handled during a selected period.
This KPI helps operations teams understand workload and compare activity by month, quarter, company, or year.
However, a higher shipment count does not always mean higher cargo volume.
Your team may process more jobs while the average size of each shipment falls. This can create more documentation, customer communication, carrier coordination, and administrative work without a similar increase in cargo movement.
Shipment count becomes more useful when it is compared with chargeable volume, cost, and average transit days.
This helps management determine whether the business is handling:
- More shipments
- Larger shipments
- More work with limited volume growth
- Higher activity with rising operational pressure
Chargeable Ocean Freight Volume
The dashboard tracks chargeable volume in cubic meters.
This KPI helps freight forwarders understand how much cargo is moving through ocean freight operations, rather than relying only on the number of shipments.
Chargeable volume analysis supports decisions around:
- Carrier capacity
- Space allocation
- Consolidation planning
- Warehouse requirements
- Operational staffing
- Customer-demand trends
By comparing volume with shipment count, managers gain a more accurate view of ocean freight demand.
Ocean Freight Cost
Cost is one of the most important ocean freight KPIs because rising expenses can reduce margin even when shipment activity is growing.
The BI dashboard tracks monthly ocean freight cost and compares current-year results with previous-year performance.
Cost changes may result from:
- Higher carrier rates
- Port or terminal charges
- Additional handling
- Route changes
- Lower capacity utilisation
- Peak-season surcharges
- Changes in cargo mix
Cost should always be reviewed alongside shipment count and chargeable volume.
If volume rises together with cost, the business should check whether the increase is proportionate.
This gives finance and commercial teams a stronger basis for pricing reviews, budgeting, and carrier negotiations.
Average Ocean Freight Days
Average days show how long ocean freight movements take during the selected period.
This KPI helps operations teams monitor transit performance and identify whether shipments are moving faster or slower than expected.
An increase in average days may be linked to:
- Port congestion
- Carrier delays
- Transshipment issues
- Route changes
- Longer-distance trade lanes
- Documentation problems
- Changes in shipment mix
A lower average may indicate better routing or improved carrier performance.
However, an overall average can hide problems on individual routes. That is why average days should also be reviewed by trade lane.
The BI dashboard compares monthly average days and current-year performance against the previous year, helping management identify whether transit efficiency is improving or declining.
Trade-Lane Volume Percentage
Trade-lane volume percentage shows how much of the overall ocean freight activity is concentrated on each route.
This helps managers understand which trade lanes are most important to the business.
A lane with a high volume percentage may require closer attention because any delay, carrier issue, or cost increase on that route can affect a larger share of customers and cargo.
This KPI helps answer questions such as:
- Which trade lanes carry the most volume?
- Is the business becoming too dependent on one route?
- Which routes are growing?
- Which lanes are losing activity?
- Where should carrier capacity be prioritized?
- Which trade lanes need stronger commercial focus?
The trade-lane volume percentage aids route planning, carrier allocation, customer management, and risk assessment.
Average Days by Trade Lane
Average days by trade lane shows how long each route takes to complete.
This is one of the most valuable KPIs in the dashboard because it connects route importance with transit performance.
A high-volume trade lane with long average days may require immediate investigation.
The issue may come from:
- Carrier schedule reliability
- Port delays
- Transshipment routing
- Customs or documentation delays
- Poor route selection
- Seasonal congestion
A lower-volume lane with slow transit may also need review, but the overall customer impact may be smaller.
By comparing trade-lane volume percentage with average days, freight forwarders can prioritize the routes that need the most attention.
Current-Year vs Previous-Year Shipment Count
Comparing current-year and previous-year shipment count helps management understand whether ocean freight activity is growing or declining.
A large increase may indicate new customer activity, stronger demand, or a change in service mix.
A decline may point to:
- Lost customers
- Seasonal changes
- Reduced demand
- Pricing pressure
- Competitor activity
- Shifts to another transport mode
Year-over-year comparison provides context that a single-period figure cannot offer.
It also helps leaders separate short-term fluctuations from longer-term business changes.
Current-Year vs Previous-Year Chargeable Volume
Year-over-year chargeable branch freight volume analysis reveals whether cargo demand is changing, even when shipment counts fluctuate.
For example:
- Shipment count may increase while volume falls
- Volume may rise faster than shipment count
- A few larger shipments may drive most of the growth
This KPI assists the business in determining whether growth is driven by more jobs, larger cargo movements, or both. It is especially useful for carrier scheduling and capacity forecasting.
Current-Year vs Previous-Year Cost
Comparing current-year and previous-year costs helps freight forwarders identify whether ocean freight expenses are increasing faster than operational activity.
A sharp cost increase may require review even when shipment count and volume are also growing.
Management can use this comparison to investigate the following:
- Carrier-rate changes
- Route selection
- Port costs
- Vendor pricing
- Capacity utilisation
- Cost recovery through customer pricing
This helps prevent cost increases from remaining hidden inside overall activity growth.
Current-Year vs Previous-Year Average Days
This KPI shows whether ocean freight transit performance has improved or declined compared with the previous year.
A lower average may indicate stronger route planning, better carrier performance, or reduced congestion.
A higher average may signal operational delays that could affect customer expectations and service reliability.
The result should also be compared with trade-lane-level average days to identify whether the change is company-wide or limited to specific routes.
Monthly Ocean Freight Trends
The dashboard shows monthly trends for shipment count, chargeable volume, cost, and average days.
This helps teams identify when performance began to change.
For example:
- Shipment count may rise suddenly in one month.
- Chargeable volume may grow without a similar increase in count.
- Cost may increase before volume does.
- Average days may improve after a route or carrier change.
Monthly trends help operations and commercial teams investigate changes earlier instead of waiting for year-end reports.
Company, Quarter, and Year Filters
Users can filter the dashboard by company, quarter, and year.
These filters allow decision-makers to focus on the exact area they need to review.
A company leader can compare business-unit performance. An operations manager can analyze one quarter. Finance teams can review cost changes by year. This makes the dashboard useful for management meetings, branch reviews, carrier discussions, and budget planning.
Conversational BI Analysis
Our conversational business intelligence analysis can accelerate the evaluation of ocean freight key performance indicators.
Instead of opening multiple dashboards and reports or applying several filters, users can ask questions such as:
- Which trade lane had the longest average transit time?
- Did ocean freight costs increase compared with last year?
- Which month recorded the highest chargeable volume?
- Which company showed the strongest shipment growth?
AI-powered business intelligence can display the answer as a chart, table, or summary. Users can then ask additional questions to further investigate the findings.
This enables executives to gain insights and speed up decision-making in ocean freight operations without having to create manual reports or apply filters to dashboards.
Conclusion
CargoWise Ocean Freight analysis dashboards allow freight forwarders to track more than just shipment activity.
It includes shipment count, chargeable volume, ocean freight cost, average transit days, trade-lane volume percentage, trade-lane transit performance, monthly trends, and comparisons of the current year to the previous year.
These KPIs assist operations, finance, commercial, and leadership teams in determining where ocean freight performance is improving, where costs are rising, and which trade lanes need attention.
Schedule a free demo with WiseBI to discover how the CargoWise Ocean Freight Analysis Dashboard can help your team monitor the right KPIs, improve trade-lane visibility, and make better ocean freight decisions.