


Revenue
Track total revenue across your global logistics operations.

Curated dashboards plus predictive insights that recommend your next move
Insights, playbooks and product thinking from the Wise BI team.

A unified view of revenue, profitability, and business performance across your global logistics network in real time.


The Problem
Tracking global logistics performance is difficult without a dashboard because data remains fragmented in disconnected, manual silos across multiple carriers and systems.

Revenue, gross profit, and GP% are difficult to review in one place.

Job and sub-job splits make it hard to see what drives performance.

Company, product, business, and transport contributions are difficult to compare.

Monthly and yearly comparisons take longer without a unified dashboard.
Solution: A unified view of global performance.
Capability Overview
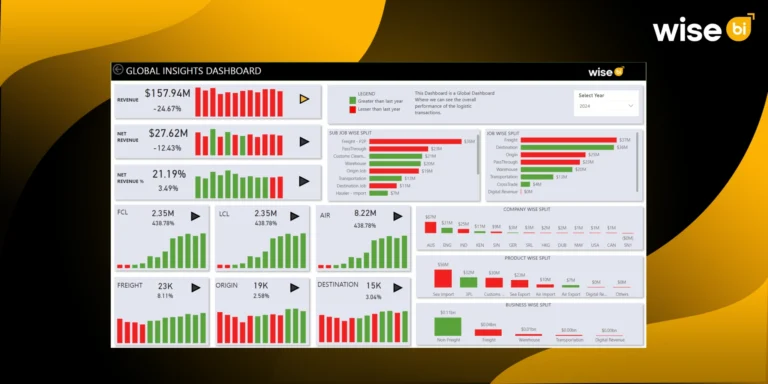
The Global Insights Dashboard brings together financial performance and operational activity into one connected workspace. Instead of reviewing multiple reports, leadership gains real-time visibility into business performance.


Monitor your organization's financial performance from one dashboard.
 Track revenue and gross profitMonitor gross profit percentageCompare monthly performance trends

Understand where operational activity is generated across your business.
Analyze job and sub-job contributionCompare operational categoriesReview business activity distribution

Evaluate performance across your logistics organization.
Compare company-wise performanceAnalyze product-wise contributionReview business unit distribution

Measure transport's contribution to overall business.
Compare transport-wise activityMeasure operational contributionEvaluate mode-wise business trendsMetric Index
Monitor global revenue, profitability, and business contribution from summary to record level.
Revenue
Track total revenue across your global logistics operations.
Gross Profit
Monitor gross profit and GP% to evaluate overall business profitability.
Job Distribution
Analyze revenue contribution across operational job categories.
Sub-Job Distribution
Review detailed operational activity through sub-job distribution.
Company Performance
Compare revenue and business contribution across companies.
Company and Product Contribution
Measure the contribution of each logistics service and product.
Business Distribution
Evaluate performance across freight, non-freight, warehouse, and other business segments.
Transport Distribution
Analyze business contribution across sea, air, road, rail, courier, and other transport modes.
Who Benefits from this Dashboard?

Monitor revenue, gross profit, and business performance across the entire logistics organization.

Analyze job, sub-job, and transport activity to improve operational efficiency.

Track revenue, gross profit, and profitability trends across companies and business units.

Compare company, product, and business performance to identify growth opportunities and operational priorities.
Our Global Insights Dashboard connects revenue, gross profit, company performance, product contribution, business segments, and transport activity into one executive view. Instead of manual reporting, leadership gains real-time global performance insights.
Key Outcomes:
 Monitor revenue, gross profit, and GP% from one dashboard.Compare company performance across your logistics network.Evaluate product and business unit contributions.Analyze job and sub-job distribution across operations.Measure transport mode contribution to overall business.Compare monthly and year-over-year performance trends.Identify high-performing and underperforming business segments.Use WiseAI to investigate trends and uncover business opportunities faster.

"Every insight is built to help leaders make faster, smarter decisions."
Consolidates revenue, gross profit, and operational metrics from multiple sources.Interactive drill-downs by company, product, job, sub-job, and transport mode.Year-over-year comparisons for quick trend analysis.Pre-mapped to CargoWise ERP data structures for zero manual consolidation.Clear visuals and indicators for fast interpretation.Mobile-ready dashboards for executives on the move.Designed for global logistics leadership teams.Blogs, newsletters and case studies on CargoWise Global Insights Dashboard.
 Blog
Blog
For global freight forwarders, visibility is one of the most important drivers of business success. Every day, CargoWise collects massive amounts of operational and…
 Newsletter
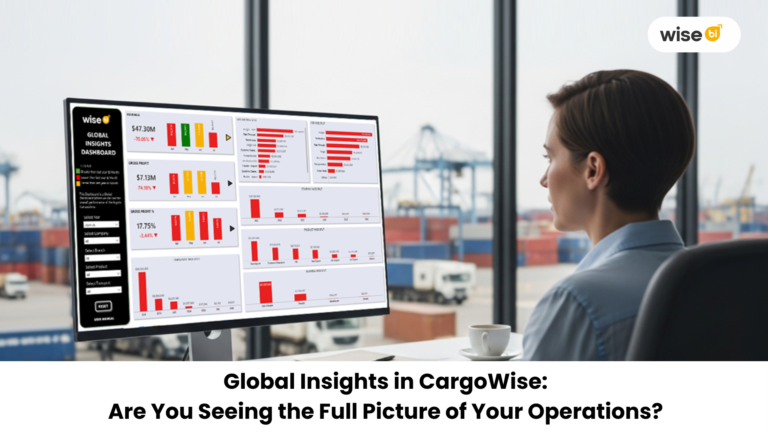
Managing logistics operations can be difficult when working with multiple areas, services, and customers. You track revenue, monitor shipments, and manage expenses. But here’s…
 Blog
Blog
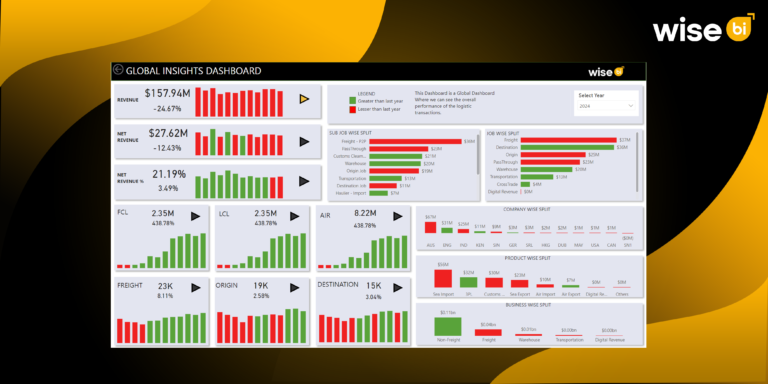
Global logistics is a fast-moving industry. Every day, companies handle thousands of shipments, invoices, and customer interactions across multiple regions. However, executives frequently struggle…
Revenue, gross profit, job-wise and sub-job-wise splits, company, product, business unit, and transport contributions.
Yes. Interactive filters allow detailed comparisons by company, product, and reporting period.
Yes. Monthly and year-over-year comparisons are included.
Yes. Job and sub-job splits show detailed revenue and gross profit distribution.
WiseAI enables natural-language queries, highlights performance changes, and surfaces trends across the global logistics network.