


LCL Volume and Shipments
Track CBM volume and shipment count together.

Curated dashboards plus predictive insights that recommend your next move
Insights, playbooks and product thinking from the Wise BI team.

Make better LCL shipment decisions with clear visibility into cargo volume, origins, monthly trends, and shipment activity.


The Problem
Shipment count alone does not show the full picture, making LCL performance difficult for teams to read accurately and consistently across every reporting period.

Shipment counts and CBM volume are reviewed separately, hiding true activity.

It is unclear which origin countries contribute the most volume and shipments.

Monthly changes in volume and shipment count are difficult to track.

Activity across countries, months, and companies requires multiple manual reports.
Solution: Instant, unified LCL volume and shipment visibility.
Capability Overview
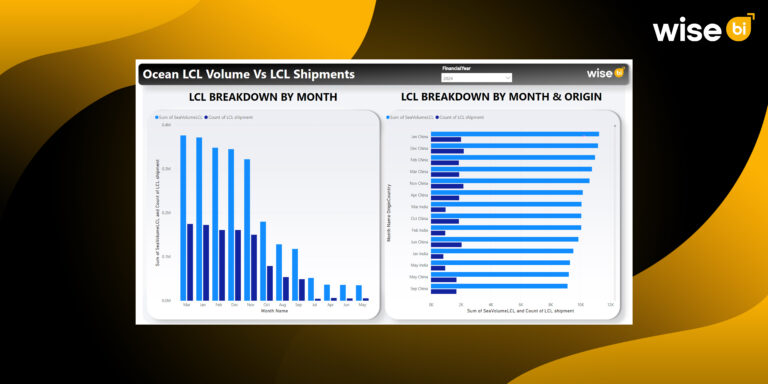
The Ocean LCL Volume vs LCL Shipments Dashboard brings together LCL volume in CBM, shipment count, monthly activity, and origin-country breakdown into one interactive workspace for complete company-wide operational and origin-country analysis at every level.


Measure LCL cargo movement using CBM across companies, months, and origin countries.
 Track LCL volume in m³Compare monthly CBM changesReview country-wise cargo volume

Understand how many LCL shipments move across the business by reporting period.
Track LCL shipment countCompare monthly shipment activityReview shipment count by origin country

Analyze where LCL activity originates across countries, companies, months, and reporting years.
Compare origin-country volumeReview country-wise shipment countIdentify major LCL origin markets

Filter LCL activity by company, year, month, and country for focused analysis.
Filter by companyFilter by year and monthFilter by origin countryMetric Index
Compare LCL cargo volume and shipment activity across months, origins, and individual records.
LCL Volume and Shipments
Track CBM volume and shipment count together.
Monthly LCL Trends
Compare volume and shipments by month.
Origin Country Performance
Identify top origin countries by volume and shipments.
Volume Distribution
See where LCL cargo volume is concentrated.
Company Analysis
Review LCL activity for the selected company.
Interactive Reporting
Filter by company, year, month, and country.
Who Benefits from this Dashboard?

Monitor LCL volume, shipment count, and origin-country activity.

Track monthly LCL movement and compare CBM against shipment count.

Understand which origin countries drive LCL activity across the network.

Review LCL freight distribution to support operational and commercial decisions.
Our dashboard compares CBM volume and shipment count by month and origin, helping teams quickly identify volume trends, shipment frequency, and key origin markets. Instead of relying on shipment totals, teams gain complete LCL volume visibility.
Key Outcomes:
 Compare LCL volume and shipment count together.Identify origin countries generating the highest CBM.Track monthly changes in LCL volume and activity.Filter data by company, country, month, and year.Investigate LCL volume patterns faster with WiseAI.

"Every detail is designed to support real-world decision-making."
Unify CargoWise LCL cargo volume and shipment activity in real time.Compare CBM and shipment count side by side each month.Break down volume and shipment contribution by origin country.Filter by company, year, month, and country.Use WiseAI and clear visuals for faster LCL analysis.Blogs, newsletters and case studies on CargoWise Ocean LCL Volume vs LCL Shipments.
 Blog
Blog
If you’re in the logistics business, keeping a close eye on your Less-than-Container Load (LCL) shipments is crucial to staying ahead of trends and…
 Blog
Blog
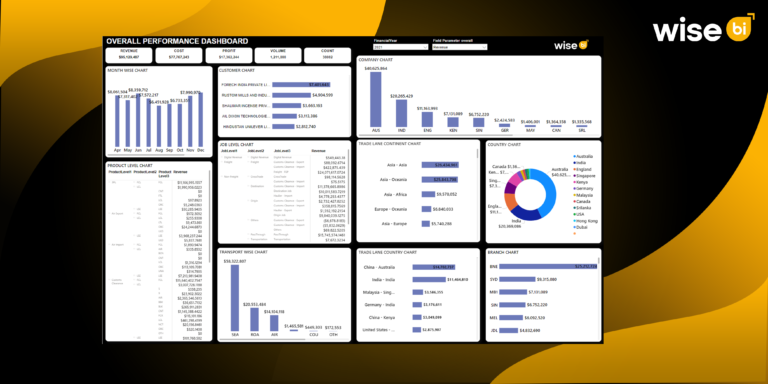
LCL shipment is one of the most important logistics elements of an international shipping business. Its operations allow businesses to send smaller quantities of…
 Blog
Blog
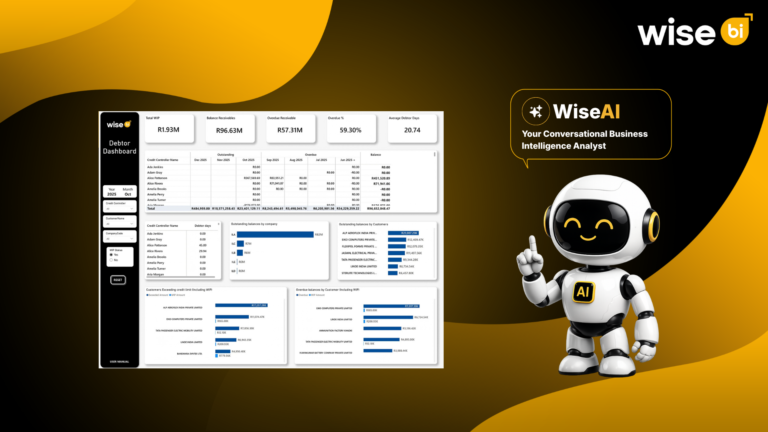
Revenue is recorded when the invoice is raised, but cash flow improves only when the customer pays. A completed freight job does not mean…
It measures LCL cargo volume in CBM and LCL shipment count across months, origin countries, companies, and selected reporting periods.
Yes. The dashboard shows LCL CBM and shipment count together so teams can compare cargo volume against shipment activity.
Yes. The origin-country breakdown helps identify countries contributing the highest LCL CBM and shipment count.
Yes. You can filter the dashboard by company, year, month, and country.
WiseAI helps users ask natural-language questions, investigate LCL volume patterns, compare shipment activity, and identify origin-country trends faster.