


Shipment Count
Track total air freight shipments, current year versus previous year.

Curated dashboards plus predictive insights that recommend your next move
Insights, playbooks and product thinking from the Wise BI team.

Understand your air freight performance across volume, cost, transit time, and operational efficiency in one connected view.


The Problem
Disconnected air freight data makes it difficult for teams to compare performance, control cost, and act early with confidence daily across every trade lane.

Count, chargeable volume, cost, and transit time are not analyzed in one place.

Comparing current-year and previous-year performance requires manual reporting.

It is difficult to identify which air routes are efficient or costly.

Performance changes are detected too late for corrective action.
Solution: Complete visibility into air freight performance.
Capability Overview
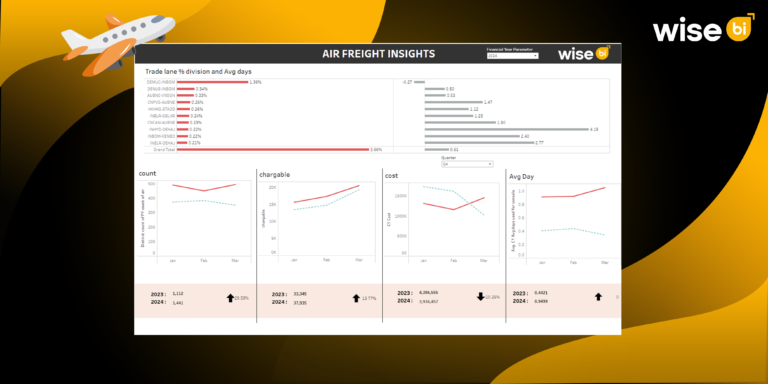
The Air Freight Insights Dashboard consolidates shipment count, chargeable volume, cost, average transit days, and trade lane performance into one interactive workspace for real-time analysis across every air freight operation and route.


Monitor overall operational performance across air freight shipments, volume, cost, and efficiency.
 Track shipment count (current year vs previous year)Analyze chargeable volume (current year vs previous year)Compare air freight cost trends

Understand delivery efficiency across air freight operations using transit time and volume.
Monitor average transit daysCompare monthly performance trendsIdentify delays in air routes

Evaluate performance across air corridors using shipment volume, cost, and transit time.
Analyze port-to-port trade lanesReview volume contribution per routeCompare average transit days by lane

Track performance changes over time across reporting periods and previous year comparisons.
Compare monthly trendsReview quarterly performanceAnalyze year-on-year changesMetric Index
Analyze air freight activity, cost, transit speed, and route efficiency from summary to record level.
Shipment Count
Track total air freight shipments, current year versus previous year.
Chargeable Volume
Measure air freight volume, current year versus previous year.
Air Freight Cost
Analyze cost trends across reporting periods.
Average Transit Days
Monitor delivery speed across air shipments.
Trade Lane Performance
Evaluate route efficiency using volume and transit time.
Volume Distribution
Understand how air freight is distributed across lanes.
Who Benefits from this Dashboard?

Monitor shipment performance, transit times, and trade lane efficiency.

Track cost, volume, and delivery performance in real time.

Optimize air routes using volume and transit insights.

Compare current-year and previous-year performance to improve strategic decisions.
Our dashboard connects shipment activity, chargeable volume, cost, and transit time into one clear operational view. Instead of waiting for manual reports, teams gain real-time air freight performance visibility.
Key Outcomes:
 Compare current-year and previous-year air freight performance.Track air freight cost changes over time.Monitor average transit days across routes.Analyze trade lane efficiency and high-volume air corridors.Detect performance shifts earlier and plan with confidence.

"Every detail is designed to support real-world decision-making."
Compare current-year and previous-year air freight performance in real time.Unify CargoWise shipment count, cost, and chargeable volume.Benchmark trade lanes and average transit times across air routes.Filter by company, year, and quarter for focused analysis.Use WiseAI and clear visuals for faster operational insights.Blogs, newsletters and case studies on CargoWise Air Freight Insights.
 Newsletter
Air freight moves quickly. That’s the entire point, right? But here’s the thing: speed doesn’t tell the entire story. If your team is only…
 Blog
Blog
The global market for supply chain analytics is expected to be worth $11.9 billion by 2030, highlighting the growing reliance on measurements and analysis.…
 Blog
Blog
Air freight operations are very dynamic and competitive, and without such tracking, it becomes challenging to optimize performance. With BI tools, CargoWise users can…
It measures shipment count, chargeable volume, cost, average transit days, and trade lane performance across current-year and previous-year comparisons.
Yes. The dashboard compares all key air freight metrics across the current year and previous year.
Yes. You can review port-to-port air routes, volume distribution, and transit times.
Yes. The dashboard provides cost comparisons across reporting periods.
Yes. Filters include company, year, and quarter for focused analysis.