


Operations Representative Count
Monitor the number of operations representatives supporting the business.

Curated dashboards plus predictive insights that recommend your next move
Insights, playbooks and product thinking from the Wise BI team.

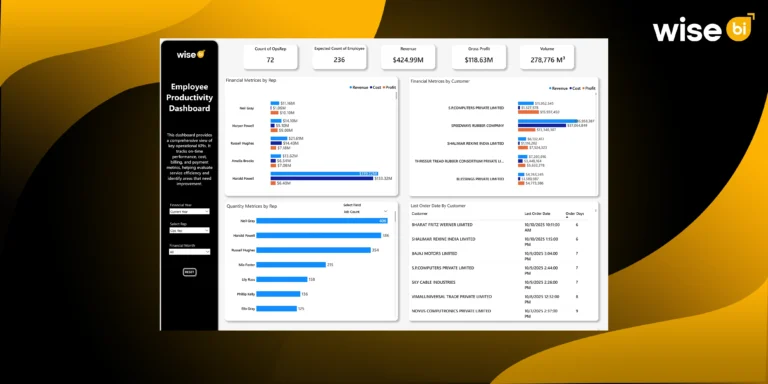
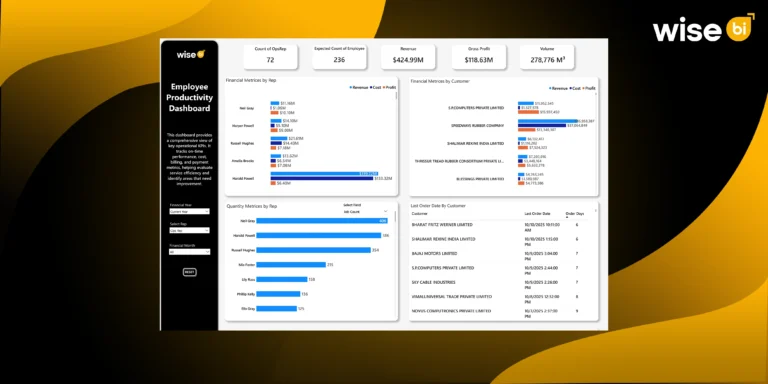
A connected view of workforce productivity, financial contribution, workload, and staffing needs across your logistics operations.


The Problem
Employee performance data is often split across financial, operational, customer, and staffing reports, making it difficult to compare contribution, workload, and capacity in one view.

Revenue, cost, and profit are rarely connected to individual employees.

Job count and shipment volume can vary significantly across representatives.

Actual headcount is not always matched against branch-level demand.

Order gaps and inactive accounts can go unnoticed.
Solution: Integrated insight into employee productivity capacity.
Capability Overview
The Employee Productivity Dashboard combines employee contribution, operational workload, customer performance, and staffing efficiency into one executive view. Instead of measuring productivity through activity alone, leadership gains real-time visibility into how employees contribute financially, manage operational demand, support customers, and affect branch capacity.


Understand the financial value generated by each representative.
 Compare revenue, cost, and profitReview gross profit contributionAnalyze performance by customer

Measure the operational activity managed by each employee.
Track job countReview shipment volumeCompare quantity metrics by representative

Understand how employees support customer relationships.
Review the customer's financial contributionMonitor last order datesIdentify customers with longer order gaps

Evaluate whether workforce capacity matches operational demand.
Compare actual and expected employee countsReview branch-level job volumeIdentify staffing gaps and excess capacityMetric Index
Track employee contribution, workload, and staffing efficiency from branch summary to representative-level detail.
Operations Representative Count
Monitor the number of operations representatives supporting the business.
Expected Employee Count
Estimate workforce requirements based on job volume and productivity expectations.
Financial Performance
Track revenue, cost, gross profit, and employee-level financial contribution.
Operational Output
Measure job count and shipment volume handled by each employee.
Customer Contribution
Compare revenue, cost, and profit generated across customer accounts.
Workforce Capacity
Review branch job count, representative count, expected staffing, and workforce differences.
Who Benefits from this Dashboard?

Understand whether workforce investment is translating into stronger financial and operational results.

Compare employee productivity, workload distribution, and branch capacity.

Evaluate revenue, cost, and profit contribution by representative and customer.

Identify staffing gaps, excess capacity, and branch-level resource requirements.
Our Employee Productivity Dashboard connects financial contribution, operational output, customer activity, and staffing requirements into one executive view. Instead of relying on job counts or headcount alone, leadership gains real-time visibility into employee value, workload balance, and resource demand across logistics operations.
Key Outcomes:
 Compare employee revenue, cost, and profit contribution.Measure job count and volume by representative.Review the employee's product and service contributions.Identify customers with declining order activity.Compare branch workloads and representative capacity.Evaluate expected versus actual staffing levels.Identify workforce shortages and excess capacity.Use WiseAI to investigate productivity gaps and resource needs faster.

"Every productivity insight helps align people, workload, and business performance."
Associate employee financial contribution with operational workload.Combines revenue, profit, job count, volume, and staffing metrics in one dashboard.Compares representative performance across customers, products, and services.Tracks customer activity through last-order analysis.Supports branch-level workforce capacity planning.Pre-mapped with CargoWise operational data for zero manual report consolidation.Provides detailed employee and product-level drill-downs.WiseAI enables natural-language productivity and workforce analysis.Blogs, newsletters and case studies on CargoWise Employee Productivity Dashboard.
 Blog
Blog
Most organizations are surrounded by data, but few have visibility into their operations. Spreadsheets, reports, and static dashboards display data without providing context. Productivity…
 Blog
Blog
Employee productivity is one of the most important drivers of operational efficiency, but it is also one of the least accurately measured. Many organizations…
 Blog
Blog
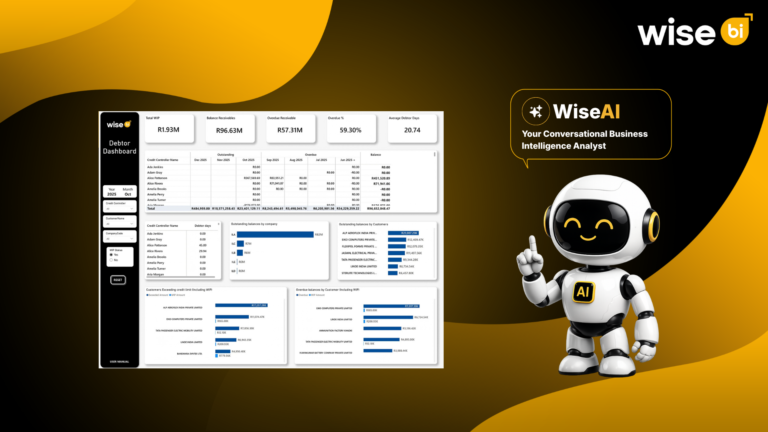
Revenue is recorded when the invoice is raised, but cash flow improves only when the customer pays. A completed freight job does not mean…
Compare revenue, cost, and profit by operations representative to identify the strongest financial contributors.
Review job count, shipment volume, and quantity metrics by representative to identify workload imbalances.
Compare actual representative counts with expected employee requirements across branches to identify staffing shortages or excess capacity.
Yes. Product-level and customer-level views show the financial and operational contribution associated with each representative.
WiseAI helps leadership compare employee performance, investigate workload differences, identify staffing needs, and uncover productivity opportunities through natural-language questions.