


Shipment Count Analysis
Track shipment activity across the business.

Curated dashboards plus predictive insights that recommend your next move
Insights, playbooks and product thinking from the Wise BI team.

See shipment activity, freight volume, revenue, cost, and profitability across your logistics business in one connected view.


The Problem
Disconnected shipment data makes it difficult for leaders to identify trends, compare performance, and make confident operational decisions across teams.

Shipment, customer, product, and profitability data remain spread across separate systems.

Important changes in volume, cost, and margin are often identified too late.

Shipment totals do not show which segments are driving profitable growth.

Static reports make it difficult to trace poor performance to specific jobs.
Solution: Integrated shipment and profitability visibility.
Capability Overview
The Shipment Analysis Dashboard brings shipment activity, customer performance, geographic insights, service mix, and job profitability into one interactive view, enabling real-time analysis from company-wide operations to individual job records with confidence every single day.


Analyze shipment performance and profitability with complete visibility across every operational level.
 Total shipments, revenue, and costGross profit and profitability trendsProfit-making vs. loss-making shipments

Measure shipment activity using the correct operational unit for each transport mode.
Track FCL activity in TEUsMeasure LCL volume in cubic metresMonitor airfreight volume in tonnes

Understand how shipment activity is distributed across key logistics movements and markets.
Compare export, import, and other shipment directionsReview customer and country-wise shipment activityMonitor origin, destination, and freight movement

Break shipment activity down by operational service, product hierarchy, and job detail.
Analyze freight and non-freight activityCompare FCL, LCL, 3PL, sea import, sea export, and other productsReview the origin and destination job performanceMetric Index
Analyze real-time shipment performance from the company level down to individual job records.
Shipment Count Analysis
Track shipment activity across the business.
Financial Performance
Measure the financial value of shipment operations.
Shipment Profitability
Identify profitable jobs and margin risks.
Transport Mode Volume
Measure FCL, LCL, and airfreight activity.
Shipment Flow
Track origin, destination, and freight counts.
Segment Performance
Analyze customers, countries, jobs, and products.
Who Benefits from this Dashboard?

Monitor shipment flow, workload distribution, service mix, and operational trends across the business.

Compare branch-level activity and investigate the jobs influencing local performance.

Identify high-volume customers, active markets, and services contributing to business growth.

Connect revenue and cost with individual jobs to understand gross profit and margin performance.
Our dashboard links shipment activity, performance, and profitability, helping logistics leaders quickly identify trends, volume changes, and margin impact. Instead of waiting for reports, leaders can instantly identify growth, declines, and margin-impacting shipments.
Key Outcomes:
 Compare operational performance across companies and branches.Identify high-volume customers, countries, and markets.Compare export, import, and other shipment directions.Monitor FCL, LCL, airfreight, job categories, and products.Track profitability and detect risks earlier with WiseAI.

"Every detail is designed to support real-world decision-making."
Synchronize shipment, revenue, cost, and gross profit data in real time.Pre-mapped with CargoWise shipment, job, product, and financial structures.Drill down by company, branch, product, mode, and job.Use WiseAI and clear visuals for faster logistics shipment analysis.Access automatically updated insights across desktop and mobile.Blogs, newsletters and case studies on CargoWise Shipment Analysis Dashboard.
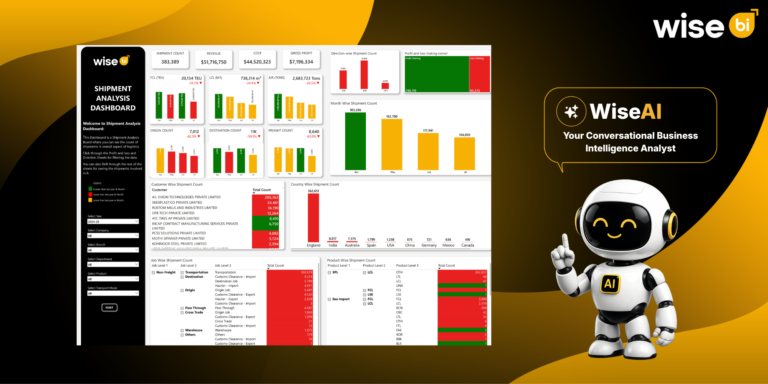 Blog
Blog
Your freight forwarding business may be handling more shipments, generating more revenue, and serving more customers. But are those shipments actually improving your profit?…
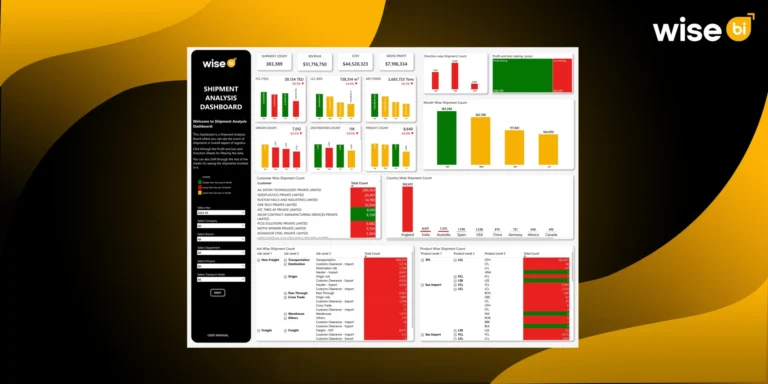 Blog
Blog
Shipment growth is only valuable when it strengthens the bottom line. For freight forwarders, using CargoWise, a busy shipment board may appear to be…
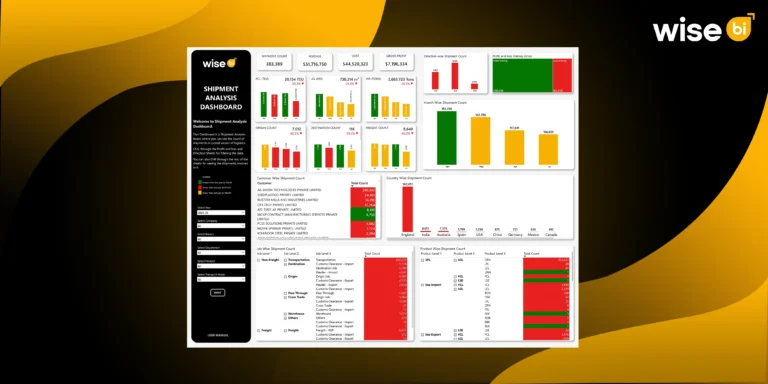 Blog
Blog
High shipment volume can look like business growth, but it doesn’t always tell the full story. A freight forwarder may be moving shipments every…
It updates automatically using connected CargoWise data, giving teams current shipment and financial insights without manual refreshes.
Yes. You can filter and compare data by company, branch, department, product, transport mode, and reporting period.
Yes. The dashboard separates profitable and loss-making shipments and allows you to drill down into individual jobs, revenue, cost, gross profit, and GP percentage.
Yes. FCL is measured in TEUs, LCL in cubic meters, and airfreight in tonnes for accurate mode-level performance analysis.
WiseAI lets you ask questions in natural language, investigate shipment trends, identify anomalies, and understand revenue, cost, and profitability changes faster.