Curated dashboards plus predictive insights that recommend your next move

Insights, playbooks and product thinking from the Wise BI team.

Boost Your Freight Revenue and Profitability with Revenue, Cost, and Sales Dashboards

Consolidate financial and commercial data across your freight forwarding and logistics business. Monitor costs, margins, job profitability, customer churn, quotations, and sales targets to identify risks and drive profitable growth.

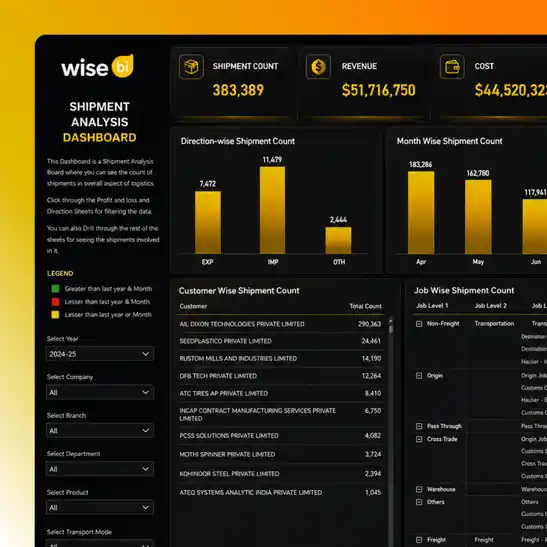
Boost Your Freight Revenue and Profitability with Revenue, Cost, and Sales Dashboards dashboard preview

Our BI Dashboard Capabilities from Revenue Analysis to Sales Performance

WiseBI delivers pre-built, AI-powered BI dashboards that connect shipment data to revenue, costs, profitability, customer activity, quotations, and sales targets to improve overall financial and commercial visibility.

01
Global Insights Dashboard preview

Global Insights Dashboard

Gain an executive-level view of financial and operational performance across your global logistics operations.

  • Compare results across companies and regions
  • Monitor revenue, costs, and gross profit
  • Identify stronger and weaker areas of the business
Explore More
Branch Insights Dashboard preview

Branch Insights Dashboard

Compare your branch performance to understand how each branch location contributes to overall revenue and profitability.

  • Review revenue, costs, and gross profit by branch
  • Compare financial contribution across locations
  • Identify branches requiring further investigation
Explore More
Country Insights Dashboard preview

Country Insights Dashboard

Analyze financial performance across countries to understand market contribution, revenue concentration, and changing business activity.

  • Compare revenue and gross profit by country
  • Monitor changes in country-level performance
  • Identify growing and declining markets
Explore More
Department Insights Dashboard preview

Department Insights Dashboard

Review the financial contribution of individual departments and understand how each business function performs.

  • Compare revenue, costs, and gross profit by department
  • Track department contribution over time
  • Identify performance gaps across business functions
Explore More
Product Insights Dashboard preview

Product Insights Dashboard

Evaluate financial performance across freight products and service categories to identify the offerings contributing most to your business.

  • Compare air, ocean, road, and other products
  • Review revenue, costs, and gross profit by product
  • Identify changes in product contribution
Explore More
Freight and Non-Freight Dashboard preview

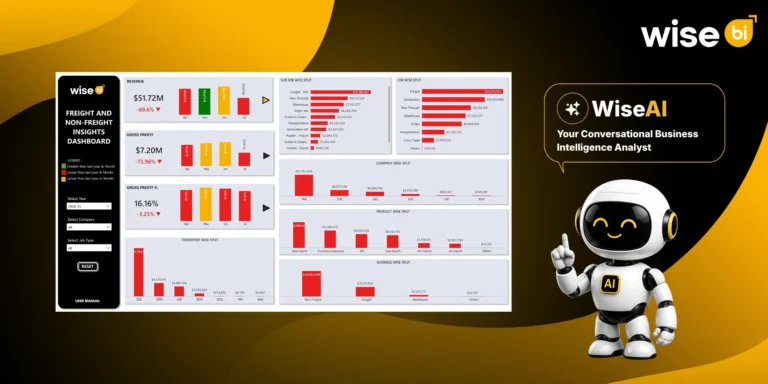
Freight and Non-Freight Dashboard

Compare freight and non-freight revenue to understand your income mix and the contribution of value-added services.

  • Separate freight and non-freight revenue
  • Compare performance across service categories
  • Monitor changes in your revenue mix
Explore More
Profit Insights Dashboard preview

Profit Insights Dashboard

Monitor gross profit and margin performance across customers, branches, departments, products, and other business segments.

  • Track gross-profit trends over time
  • Compare profitability across key business areas
  • Identify high- and low-profit contributors
Explore More
Churned Revenue Dashboard preview

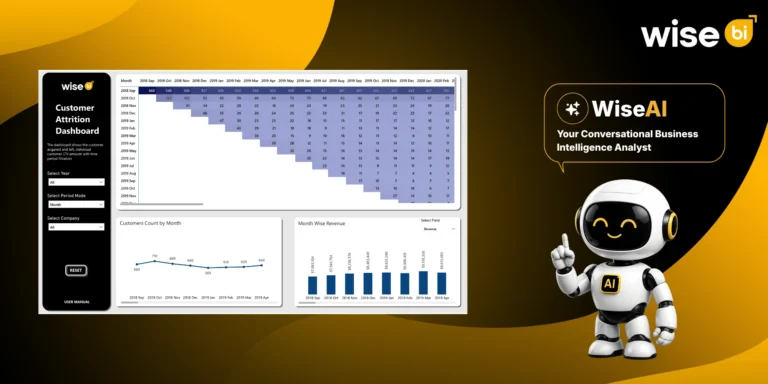
Churned Revenue Dashboard

Identify revenue lost from customers whose activity has declined or stopped and prioritize account-retention efforts.

  • Recognize customers contributing to lost revenue
  • Compare churned revenue across reporting periods
  • Identify customer recovery opportunities
Explore More
Job Profit Dashboard preview

Job Profit Dashboard

Analyze revenue, costs, and gross profit at the individual job level to identify margin pressure and loss-making freight movements.

  • Compare revenue, costs, and gross profit by job
  • Identify profitable and loss-making jobs
  • Investigate the factors affecting job margins
Explore More
Quotation Dashboard preview

Quotation Dashboard

Monitor quotation activity and conversion performance to understand how effectively sales opportunities become active business.

  • Track quotation numbers and values
  • Compare accepted, rejected, and pending quotations
  • Review conversion performance across sales teams
Explore More
Sales Target Dashboard preview

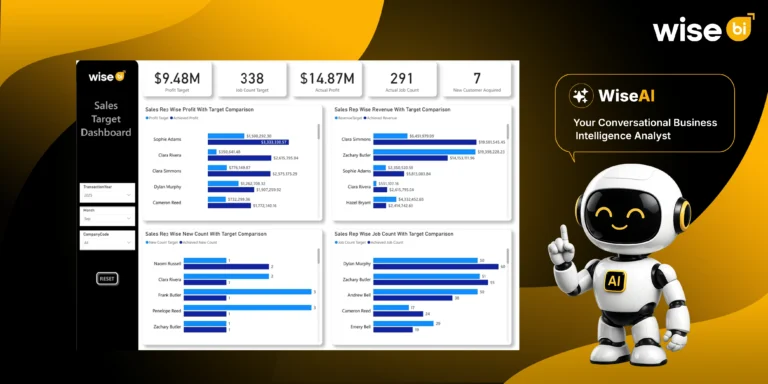
Sales Target Dashboard

Compare actual sales performance against established targets to identify progress, shortfalls, and areas requiring attention.

  • Monitor sales-target achievement
  • Compare actual performance against goals
  • Review results by salesperson, team, or branch
Explore More

Benefits of Our Revenue, Cost, and Sales Dashboards for Better Business Decisions

Complete Financial Visibility

Monitor freight revenue, operating costs, gross profit, customer churn, quotations, and sales targets across your business.

Stronger Margin Control

Identify rising costs, revenue leakage, low-margin services, and loss-making jobs before they have a greater impact on profitability.

Clearer Business Performance

Compare outcomes across countries, branches, departments, freight products, customers, and trade lanes to see what drives revenue growth.

Better Customer Retention

Recognize declining customer activity early and help commercial teams prioritize valuable accounts for retention and recovery.

Improved Sales Performance

Track quotation conversions and sales targets to identify gaps, measure team performance, and focus on stronger opportunities.

Faster Business Analysis

Analyze shipment performance quickly with Conversational BI while reducing reliance on manual reports and spreadsheets.

Frequently Asked Questions

The dashboards connect freight revenue, operating costs, job profitability, customer retention, quotations, and sales results. This helps freight forwarding leaders protect margins, identify revenue leakage, retain valuable shippers, improve quote conversions, and focus resources on profitable customers, services, branches, and trade lanes.

WiseBI's Revenue, Cost, and Sales Dashboards help logistics teams monitor revenue, costs, profitability, customer churn, quotations, and sales targets across key business areas. Conversational BI also lets users ask questions and receive instant charts, summaries, and insights.

WiseBI combines pre-built logistics dashboards, customizable reporting, and conversational BI. It helps you analyze revenue, costs, job profitability, customer churn, quotations, and sales targets without relying on disconnected reports or time-consuming spreadsheet analysis.

Yes, the dashboards let you compare revenue, costs, and profitability across global operations, countries, branches, departments, freight products, non-freight services, customers, and individual jobs. You can move from company-wide results to detailed views to identify which areas are driving growth, reducing margins, or require attention.

Yes. WiseBI can customize KPIs, filters, reporting periods, sales targets, visualizations, and drill-down views based on your business requirements. Views can also be tailored for executives, finance teams, branch managers, and sales teams.

Ready to Increase Your Freight Revenue and Profitability with Our BI Dashboards?

Schedule a Call