


Loss-Making Customers
Identify customers generating negative gross profit.

Curated dashboards plus predictive insights that recommend your next move
Insights, playbooks and product thinking from the Wise BI team.

Spot revenue leakage across your logistics business with real-time visibility before it impacts profitability across the board.


The Problem
Revenue leakage rarely comes from a single source. Losses are often spread across customers, services, branches, and operational activities, making them difficult to detect before they impact profitability.

Loss-making customers, products, and departments are often buried within multiple operational reports.

Small losses across different business areas gradually reduce overall profitability.

Jobs, branches, and business units contributing to losses are not always easy to identify.

Without a consolidated view, resolving loss-making activities becomes reactive instead of proactive.
Solution: Complete visibility into where revenue leaks.
Capability Overview
The Churned Revenue Dashboard brings together loss-making customers, companies, branches, products, jobs, and departments into one executive workspace. Instead of reviewing multiple financial reports, leadership gains real-time visibility into the business areas reducing profitability, making it easier to prioritize corrective actions.


Identify customers reducing overall profitability.
 Review loss-making customersCompare customer lossesPrioritize corrective actions

Understand where revenue leakage occurs across the organization.
Compare companiesReview branch lossesAnalyze departmental impact

Identify services reducing business margins.
Compare product lossesReview operational jobsEvaluate service performance

Focus improvement efforts where they deliver the greatest financial impact.
Identify loss-making business areasAnalyze operational contributionSupport recovery planningMetric Index
Identify loss-making customers, branches, products, and departments from summary to record level.
Loss-Making Customers
Identify customers generating negative gross profit.
Loss-Making Companies
Compare loss contributions across companies.
Loss-Making Branch
Review branches contributing to revenue leakage.
Loss-Making Product
Identify products generating financial losses.
Loss-Making Jobs
Analyze operational jobs affecting profitability.
Loss-Making Department
Compare departments contributing to business losses.
Who Benefits from this Dashboard?

Identify the business areas requiring immediate corrective action.

Review customer profitability and reduce revenue leakage.

Monitor losses across customers, companies, branches, products, and departments.

Identify operational activities reducing business profitability.
Our Churned Revenue Dashboard connects customer losses, operational activities, service performance, and business risk into one executive view. Instead of discovering losses after financial reporting, leadership gains real-time visibility into revenue leakage, enabling faster corrective action and stronger financial control.
Key Outcomes:
 Identify loss-making customers early on.Compare losses across companies and branches.Review products reducing business profitability.Analyze departments contributing to financial losses.Investigate operational jobs impacting margins.Prioritize recovery opportunities across the business.Use WiseAI to investigate revenue leakage and margin risks faster.Compare loss trends across reporting periods.

"Every insight helps leadership act before losses grow."
Connects loss-making customers, products, and operations in one view.Highlights revenue leakage across commercial and operational activities.Interactive filtering by month and reporting year.Assess business risks across multiple organizational dimensions.Pre-mapped with CargoWise data for zero manual report consolidation.Clear visualizations for faster identification of financial risks.Supports proactive decisions to reduce losses and improve profitability.WiseAI enables natural-language revenue leakage analysis.Blogs, newsletters and case studies on CargoWise Churned Revenue Dashboard.
 Blog
Blog
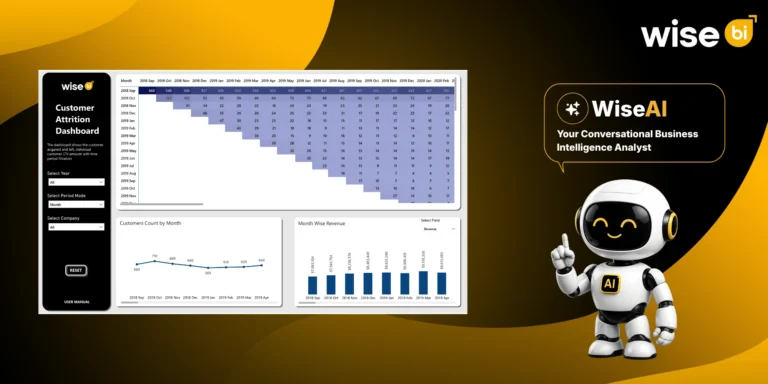
Customer churn rarely happens overnight. A freight forwarding customer may start booking less often, go quiet for a few months, reduce shipment frequency, or…
 Blog
Blog
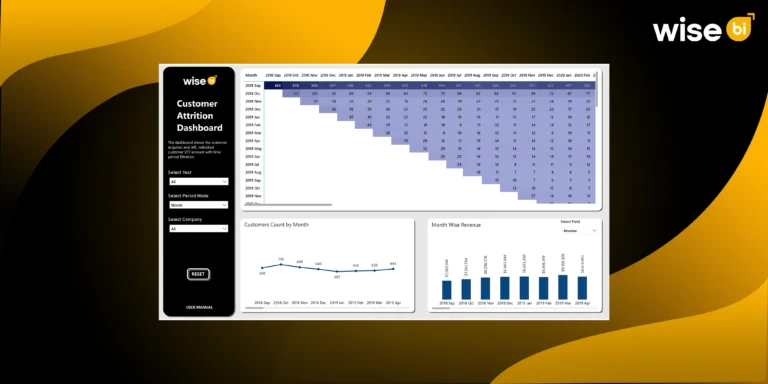
Customer attrition is one of the most overlooked threats to logistics operations. While teams monitor shipments, invoices, and service performance, many overlook the gradual…
 Blog
Blog
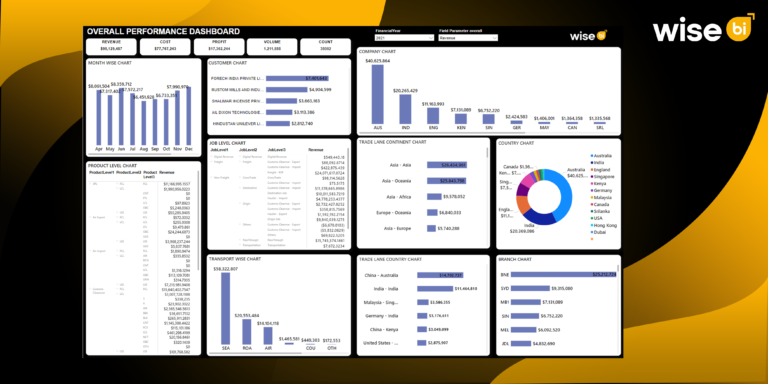
Did you know that in recent surveys, the majority of businesses specified client retention as a significant focus area due to the high costs…
The dashboard identifies loss-making customers based on gross profit, helping leadership prioritize corrective action.
You can compare losses across companies and branches to identify where financial risks are occurring.
The dashboard highlights loss-making products, jobs, and departments, helping teams identify operational areas that need attention.
Yes. Monthly and yearly filters allow you to review loss-making trends and evaluate changes over time.
WiseAI helps you investigate loss patterns, identify margin risks, ask natural-language questions, and uncover opportunities to improve profitability.