


Receiving Volume
Track total receive count, total quantity, and average units per inbound receipt.

Curated dashboards plus predictive insights that recommend your next move
Insights, playbooks and product thinking from the Wise BI team.

Strengthen your inbound warehouse operations by gaining complete visibility into receiving performance and putaway productivity.


The Problem
Receiving, putaway, and warehouse activity are often tracked through separate reports. Without a connected view, delays, workload imbalances, and performance gaps can remain hidden.

Inbound counts and quantities are spread across different reports, limiting operational visibility.

Without tracking putaway time, teams may not identify storage delays early enough.

Disconnected data makes it harder to compare inbound activity across warehouse locations.

Operational reports rarely connect inbound activity with revenue, cost, and profit.
Solution: Complete inbound intelligence for faster receiving.
Capability Overview
The Warehouse Inbound Dashboard connects receiving activity, putaway operations, warehouse performance, and financial outcomes into one executive workspace. Instead of checking manual reports, leadership gains the visibility to monitor warehouse inbound operations and improve warehouse efficiency.


Monitor inbound activity across reporting periods.
 Track total receive countMeasure received quantitiesReview monthly receiving trends

Understand how quickly goods move into storage.
Monitor average putaway daysCompare monthly putaway performanceIdentify processing delays

Compare inbound operations across locations.
Review warehouse-wise quantitiesCompare warehouse revenueAnalyze unit distribution

Understand what is entering each warehouse.
Compare inbound volume by clientReview received productsIdentify volume concentrationMetric Index
Track receiving, putaway, and financial performance across the warehouse network from summary to docket-level detail.
Receiving Volume
Track total receive count, total quantity, and average units per inbound receipt.
Putaway Performance
Monitor average putaway days and monthly putaway trends.
Warehouse Activity
Compare received quantities and operational contribution across warehouse locations.
Docket Status
Review finalized and cancelled inbound receipts to understand execution quality.
Customer and Product Mix
Analyze inbound quantities by client, product, and packaging unit.
Financial Performance
Monitor revenue, cost, and profit generated through inbound warehouse operations.
Who Benefits from this Dashboard?

Gain a clear view of inbound activity, warehouse contribution, and financial performance.

Monitor receiving volumes, putaway time, and operational workload across locations.

Identify delays, compare warehouse performance, and improve inbound execution.

Connect inbound activity with revenue, cost, and profit contribution.
The warehouse inbound dashboard provides a connected view of receiving, putaway, warehouse activity, and operational performance. Instead of manual reports, leadership can identify problems earlier, improve warehouse efficiency, and make faster operational decisions.
Key Outcomes:
 Monitor receiving performance across warehouse locations.Compare putaway efficiency and processing delays.Analyze inbound activity by customer and product.Connect warehouse operations with revenue and profit.Use WiseAI to identify trends and bottlenecks.

"Each insight is designed to help leaders improve inbound warehouse efficiency."
Combines receiving, putaway, warehouse, and financial metrics.Tracks inbound quantity, receive count, and docket status.Compares performance across warehouses and reporting periods.Pre-mapped with CargoWise warehouse data for faster reporting.WiseAI enables natural-language warehouse analysis.Blogs, newsletters and case studies on CargoWise Warehouse Inbound Dashboard.
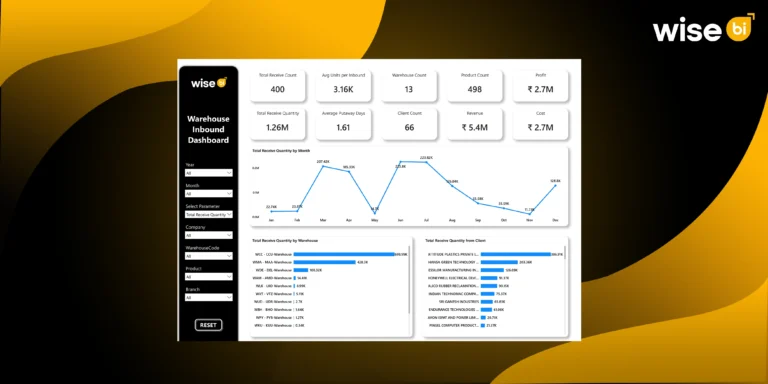 Blog
Blog
Inbound isn’t just where your warehouse operations begin; it’s where performance is either built or quietly broken. Warehouse inbound operations produce massive amounts of…
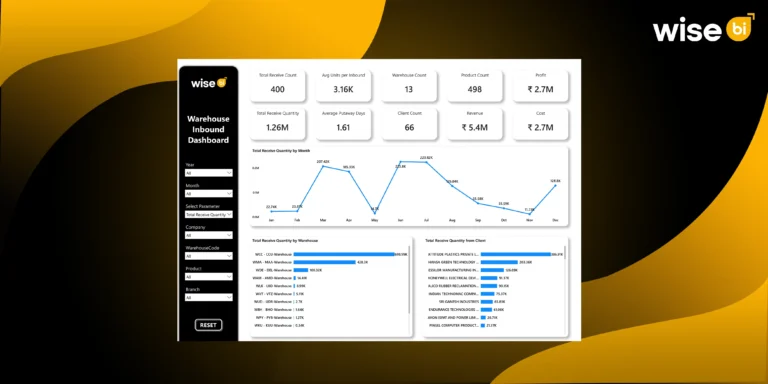 Blog
Blog
Inbound operations are often the most underestimated part of warehouse management until something goes wrong. A sudden surge of shipments, delayed unloading, or slow…
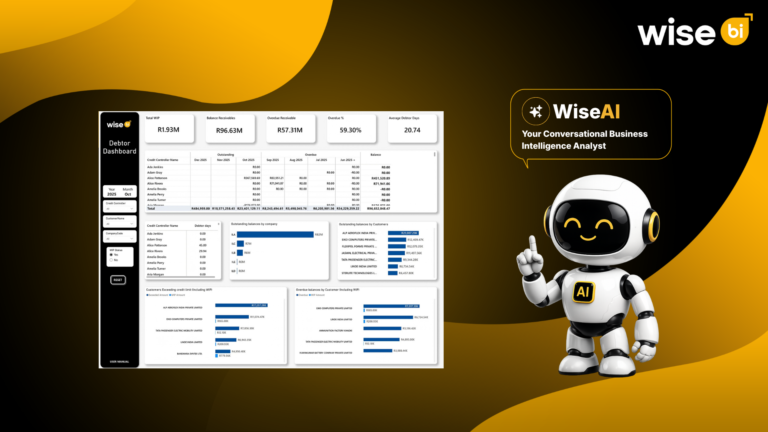 Blog
Blog
Revenue is recorded when the invoice is raised, but cash flow improves only when the customer pays. A completed freight job does not mean…
Track receiving activity, inbound quantities, and putaway performance from one connected operational dashboard.
Compare receive quantities, warehouse activity, and operational performance across every warehouse.
Review average putaway days, warehouse performance, and receiving trends to quickly identify operational bottlenecks.
Yes. The dashboard compares inbound quantities across customers, products, and warehouse locations to support better operational planning.
WiseAI helps investigate receiving performance, putaway efficiency, warehouse trends, and operational bottlenecks through natural-language questions.