



Start Faster with Ready-to-Use Warehouse Dashboards
Begin with prebuilt dashboards for inbound, outbound, warehouse insights, and picking activity, then customize them around your facilities, customers, products, and reporting requirements.
Curated dashboards plus predictive insights that recommend your next move
Insights, playbooks and product thinking from the Wise BI team.

Warehousing & Distribution Analytics
Gain a connected view of inbound receipts, inventory activity, picking, outbound orders, customer volumes, workforce output, costs, and profitability. WiseBI combines purpose-built warehouse dashboards, custom BI development, and conversational BI to help your teams manage workloads, identify operational gaps, use resources effectively, and make faster business decisions.
Warehousing involves receiving, storing, managing, picking, and preparing goods for dispatch. Distribution coordinates the movement of those goods from warehouses to customers, stores, or other delivery locations.
These activities generate operational and financial data across inbound receipts, inventory movements, picking tasks, outbound orders, customers, employees, revenue, and costs. When this information is spread across warehouse systems, logistics platforms, spreadsheets, and separate reports, it becomes difficult to understand workloads and identify operational issues.
WiseBI connects this data through warehousing and distribution analytics dashboards, helping teams monitor activity, compare performance, plan resources, control costs, and make informed operational decisions.
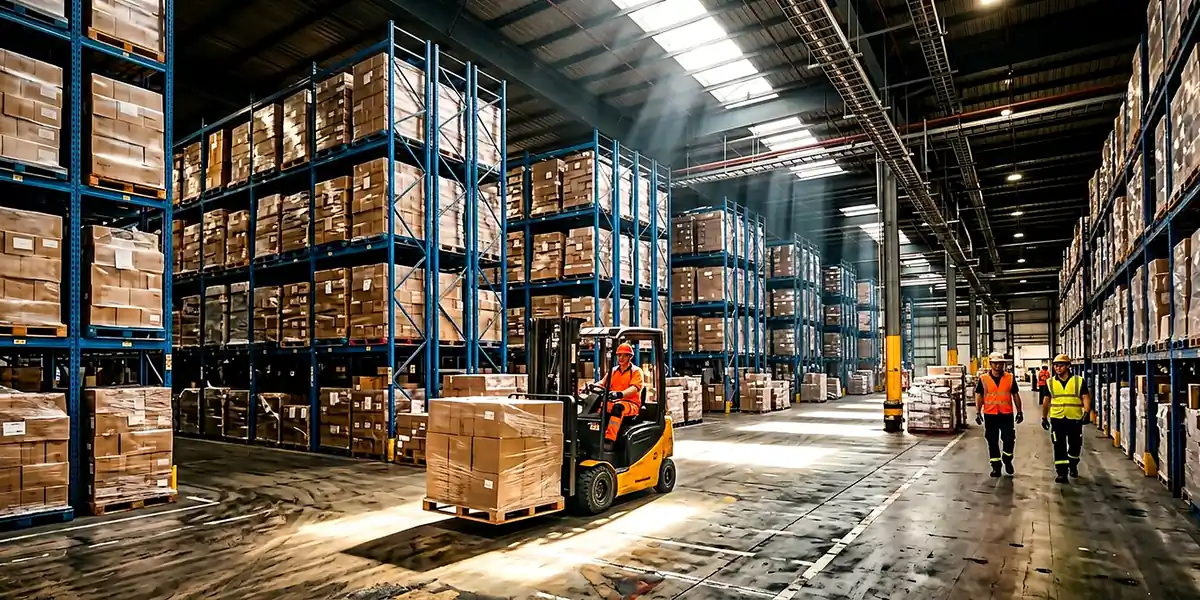
Warehouse BI Dashboards


Get a complete view of warehouse activity, inventory movement, and operational performance to improve overall efficiency.
Explore More

Monitor available data across incoming receipts, customers, products, quantities, warehouse activity, and reporting periods.
Explore More

Analyze outbound orders, dispatched quantities, customers, products, warehouse activity, and reporting periods.
Explore More

Review available picking tasks, picked quantities, products, customers, employees, and completion activity.
Explore MoreSegment warehouse performance across key operational areas to identify trends, gaps, and improvement opportunities.
Explore MoreCompare activity and performance across departments to understand workload distribution and improve operational coordination.
Explore MoreOur Warehouse BI Expertise
We bring receiving, inventory, picking, dispatch, workforce, customer, and financial data into clear dashboards. This helps warehouse teams compare activity, identify process gaps, and understand what drives operational performance.
50+
Ready-to-use BI Dashboards
07+
Happy Clients
25+
Years of Experience
100+
TB Data Analyzed
Why WiseBI?
We bring 25+ years of combined logistics and business intelligence experience to help warehousing and distribution teams improve operational visibility, use resources effectively, and make confident business decisions.
Begin with prebuilt dashboards for inbound, outbound, warehouse insights, and picking activity, then customize them around your facilities, customers, products, and reporting requirements.
Bring key warehouse activities into connected reports to understand how receiving volumes, inventory movement, picking workloads, and outbound orders affect operations.
Analyze available activity across warehouses, branches, departments, customers, products, employees, and reporting periods.
Configure dashboards for your facilities, processes, warehouse KPIs, calculation methods, filters, reporting periods, and user access requirements.
Our BI Implementation Process

We review your inbound, inventory, picking, outbound, customer, workforce, financial, and reporting data across your operations.
A clear view of your reporting priorities

We connect and organize relevant data from your warehouse, logistics, accounting, and other business systems.
Consistent, analysis-ready warehouse data

We define consistent calculations for receiving, inventory, order volumes, picking, dispatch, productivity, and other relevant warehouse KPIs.
Reliable metrics across your dashboards
We configure dashboards with appropriate filters, drill-downs, reporting periods, and role-based access.
Relevant warehouse metrics in one interface
We validate the data, calculations, filters, and dashboard outputs before configuring refresh schedules.
Reliable dashboards with scheduled updates
We train your teams and support future dashboard refinements, new KPIs, and reporting requirements as your operation grows.
BI that evolves with your operation
A warehouse BI dashboard is a visual reporting tool that brings receiving, inventory, picking, outbound, customer, and workforce data into one view. It helps teams monitor warehouse activity, compare performance, and investigate operational issues.
WiseBI can help you analyze inbound receipts, inventory activity, picking, outbound orders, customers, products, warehouse locations, users, and available productivity measures. The exact reporting scope depends on the data captured in your connected systems.
Yes. Warehousing and distribution are among WiseBI's core logistics areas. Available solutions include Warehouse Inbound, Warehouse Outbound, Warehouse Insights, and Warehouse Picking dashboards.
Warehouse information may be spread across operational systems, spreadsheets, and separate reports. Power BI dashboards organize this data into visual reports, making it easier to monitor goods movement, compare workloads, identify process gaps, and investigate performance issues.
Yes. WiseBI can customize warehouse dashboards around your facilities, customers, products, locations, activities, KPIs, calculations, reporting periods, filters, drill-downs, and user-access requirements.