


Financial Performance
Track revenue, cost, and gross profit across every trade lane.

Curated dashboards plus predictive insights that recommend your next move
Insights, playbooks and product thinking from the Wise BI team.

Complete visibility into the trade lanes that drive revenue, profitability, and logistics growth across your business.


The Problem
Trade lane performance is often spread across multiple operational and financial reports, making it difficult to understand which routes generate the greatest business value.

Revenue alone does not show which trade lanes generate the strongest gross profit.

Origin and destination performance is often analyzed separately rather than as one connected route.

High-performing countries, continents, and products can remain unnoticed without consolidated reporting.

Comparing trade lane performance across regions requires significant manual analysis.
Solution: Connected insight into trade lane performance.
Capability Overview
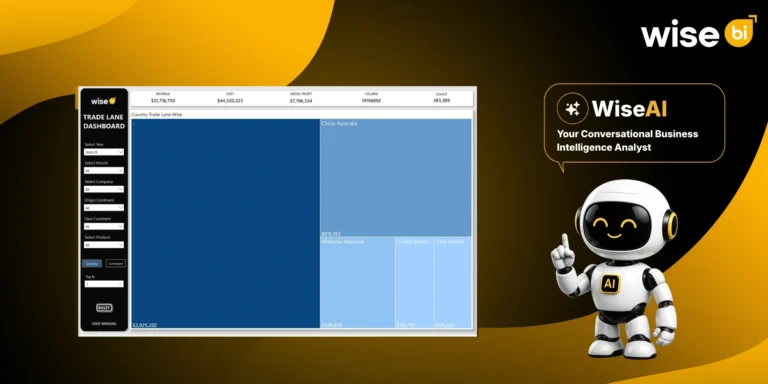
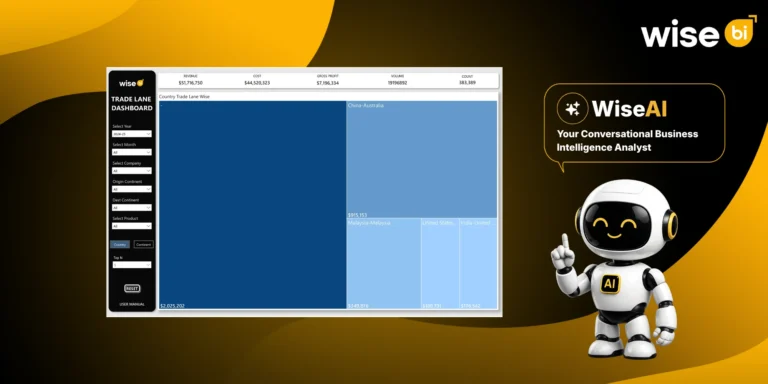
The Trade Lane Dashboard combines trade lane profitability, shipment activity, geographic performance, and product movement into one executive workspace. Instead of reviewing disconnected operational reports, leadership gains real-time visibility into which global routes deliver the strongest financial and operational performance.


Evaluate the financial performance of every logistics route.
 Compare revenue, cost, and gross profitReview shipment volumeMonitor shipment count

Understand how freight moves across global markets.
Compare country-to-country trade lanesReview origin and destination regionsAnalyze continent performance

Identify the routes creating the greatest business value.
Compare productsReview company performanceIdentify top-performing trade lanes

Understand where logistics operations perform best.
Compare global shipping routesReview regional demandIdentify growth opportunitiesMetric Index
Compare route profitability and shipment performance from global summary to trade lane-level detail.
Financial Performance
Track revenue, cost, and gross profit across every trade lane.
Shipment Volume
Measure freight volume moving through each logistics route.
Shipment Count
Monitor shipment count across countries and trade lanes.
Trade Lane Performance
Compare origin-to-destination route performance.
Geographic Analysis
Analyze trade lane performance by country and continent.
Commercial Performance
Review company and product contribution across global trade lanes.
Who Benefits from this Dashboard?

Understand which trade lanes generate the strongest business performance.

Identify profitable routes and uncover new market opportunities.

Monitor shipment flow and optimize network performance.

Evaluate revenue, cost, and profitability across global logistics routes.
Our Trade Lane Dashboard connects financial performance, shipment activity, geographic analysis, and commercial insights into one executive view. Instead of relying on disconnected route reports, leadership gains real-time visibility into the trade lanes driving business growth and profitability.
Key Outcomes:
 Compare trade lane performance across countries and continents.Monitor shipment volume and shipment count.Analyze country-to-country logistics routes.Compare the origin and destination continent performance.Evaluate company and product contribution.Identify opportunities to strengthen global trade lane performance.Discover opportunities to optimize logistics networks.Use WiseAI to investigate trade lane trends and commercial opportunities faster.

"Every trade lane insight strengthens your global logistics network."
Highlights top-performing trade lanes through visual route comparisons.Connects financial performance with global trade lane analysis.Supports strategic trade lane planning through connected route intelligence.Interactive analysis by company, product, year, month, origin, destination, country, and continent.Combines revenue, cost, gross profit, volume, and shipment activity in one dashboard.Provides interactive route analysis across global logistics networks.Pre-mapped with CargoWise operational data for zero manual report consolidation.WiseAI enables natural-language trade lane and route performance analysis.Blogs, newsletters and case studies on CargoWise Trade Lane Dashboard.
 Blog
Blog
Trade lanes are more than routes between two countries. For freight forwarders, every lane represents a mix of shipment activity, revenue, cost, gross profit,…
 Blog
Blog
Trade lanes are central to freight forwarding performance. Every origin-to-destination route contributes its own mix of shipments, freight volume, revenue, cost, and gross profit.…
 Blog
Blog
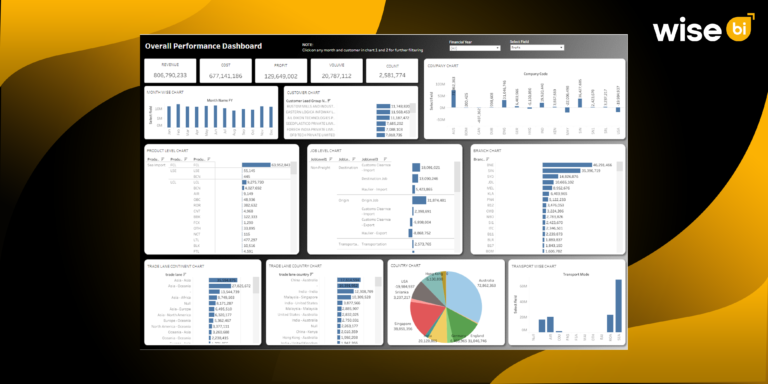
What if you could identify supply chain disruptions before they occur? Most logistics teams deal with delays, rising expenses, and unexpected problems only after…
Compare revenue, cost, and gross profit across origin-to-destination routes to identify your most profitable trade lanes.
Analyze trade lane performance by country and continent to understand where your strongest markets are located.
Review shipment volume and shipment count across routes to evaluate operational demand and network performance.
Yes. The dashboard allows you to compare financial and operational performance by company, product, origin, destination, and reporting period.
WiseAI helps you investigate route profitability, identify high-performing markets, compare trade lane performance, and uncover growth opportunities through natural language questions.