


Trade lanes are central to freight forwarding performance. Every origin-to-destination route contributes its own mix of shipments, freight volume, revenue, cost, and gross profit.
But the routes moving the most freight are not always the routes contributing the most value.
One trade lane may generate high shipment volume and strong revenue but deliver comparatively weak gross profit. Another may handle fewer shipments yet make a stronger financial contribution. Performance can also vary across countries, continents, products, companies, and reporting periods.
When shipment activity, financial results, origin and destination data, and product performance are reviewed separately, logistics companies may see where freight is moving without clearly understanding which trade lanes are performing well and what is driving that performance.
What is a CargoWise Trade Lane Dashboard?
A CargoWise Trade Lane Dashboard is a business intelligence reporting solution that uses CargoWise operational and financial data to analyze performance across origin-to-destination logistics routes.
Instead of reviewing shipment volume, profitability, and geographic performance in separate reports, the dashboard brings relevant trade lane metrics into one visual reporting environment.
Users can analyze:
- Revenue
- Cost
- Gross profit
- Shipment volume
- Shipment count
- Origin and destination routes
- Country and continent performance
- Company contribution
- Product contribution
- Monthly and yearly performance
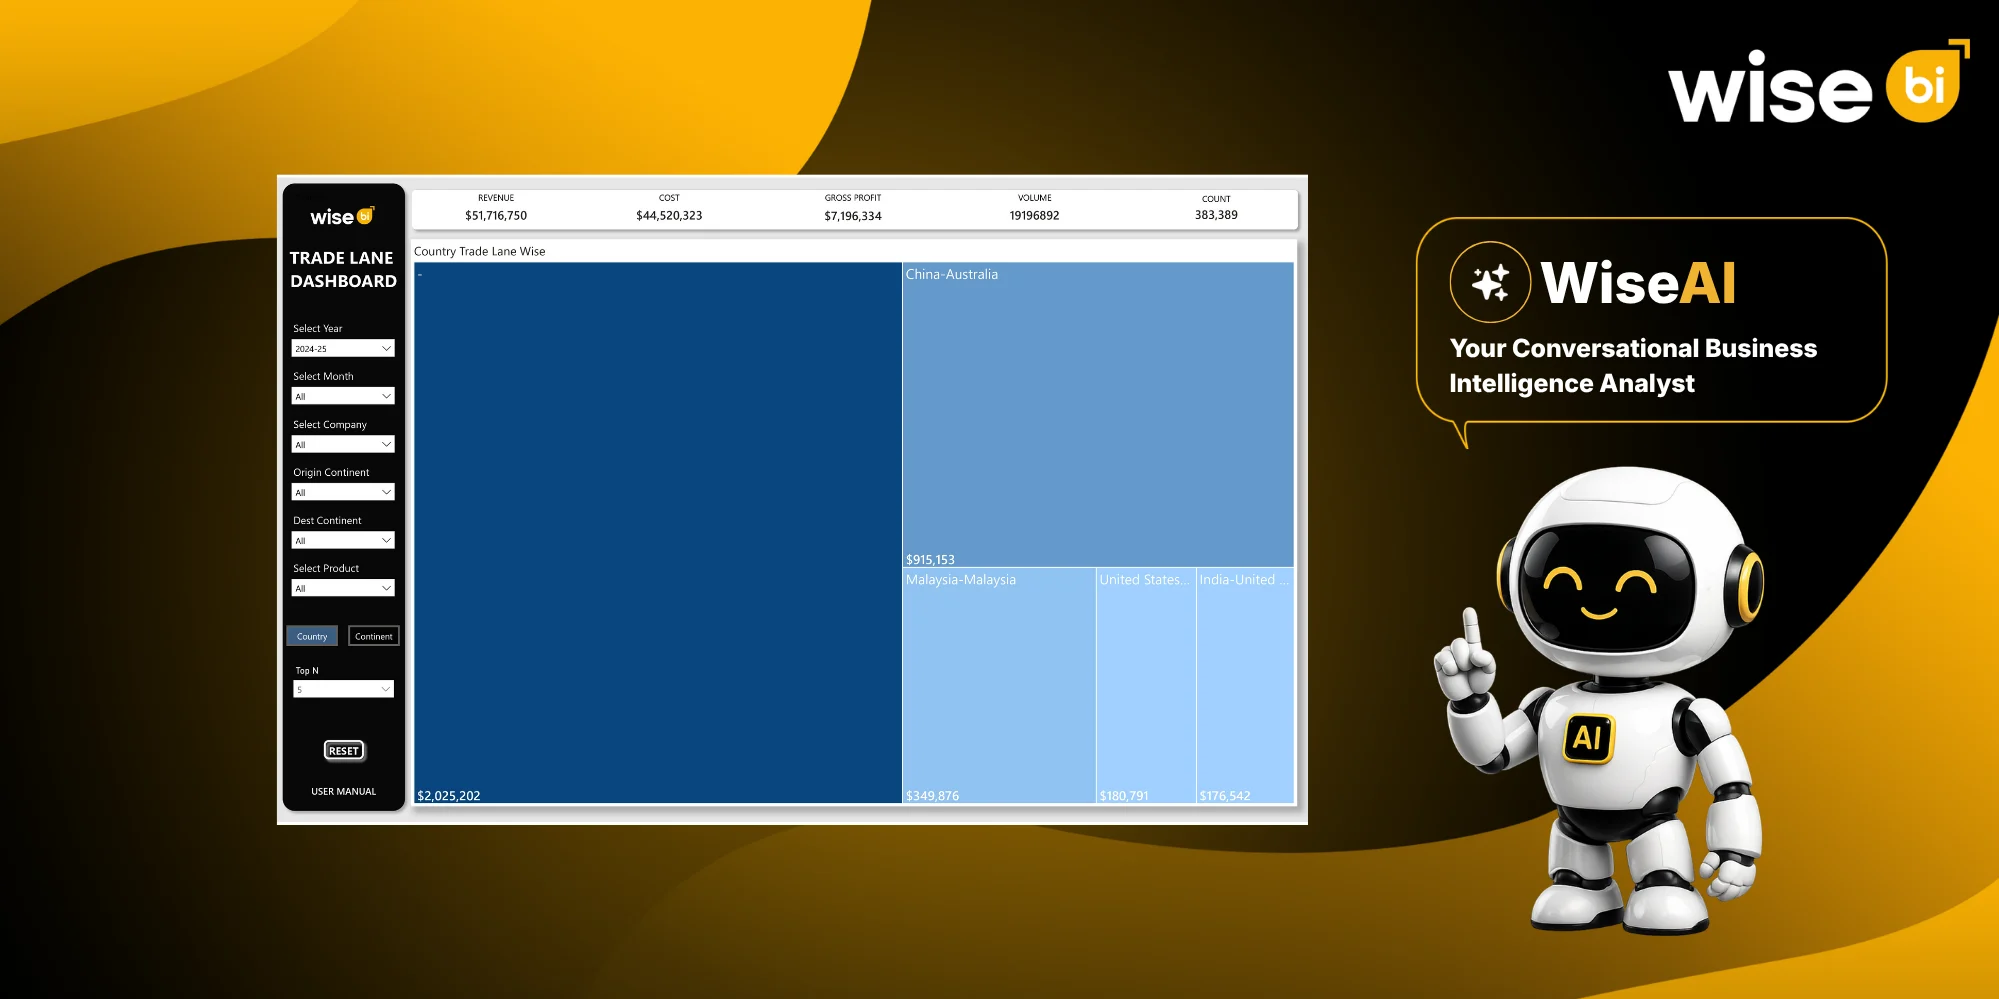
The AI-powered CargoWise trade lane dashboard can be filtered by company, product, year, month, origin, destination, country, and continent. This enables users to navigate from an overall network view to a specific trade lane and comprehend the operational and financial outcomes.
Why is Trade Lane Performance Difficult to Understand?
A trade lane cannot be evaluated using a single metric.
Shipment count shows how active a route is, but it does not show the financial value of that activity. Revenue shows how much business a route generates, but without cost and gross profit, it does not reveal the quality of that revenue.
Geography adds another challenge. Reviewing origin and destination countries separately does not show how the complete origin-to-destination trade lane performs. The same origin may connect to several destinations, with each route producing a different financial result.
As logistics networks expand, management needs to answer questions such as:
- Which origin-to-destination routes generate the strongest gross profit?
- Which high-volume lanes deliver weaker financial results?
- Is revenue growing faster than cost on a particular lane?
- Which countries and continents contribute most to trade lane activity?
- Which products are driving performance on specific routes?
- Is a trade lane improving or declining over time?
A CargoWise trade lane analysis connects these questions in one view rather than requiring separate investigations.
Find Out Which Trade Lanes Generate the Strongest Financial Return
Revenue alone can make a trade lane appear more successful than it actually is.
A route may rank highly for revenue while also carrying substantial costs. Another route with lower revenue may retain stronger gross profit.
WiseBI’s CargoWise trade lane dashboard allows users to compare revenue, cost, and gross profit across origin-to-destination routes.
This gives management a clearer view of:
- High-revenue routes with strong gross profit
- High-revenue routes with weaker financial contribution
- Smaller trade lanes producing meaningful gross profit
- Routes where costs are reducing the value of revenue
Instead of asking only which trade lane generates the most revenue, management can determine which routes contribute the strongest financial value after costs are considered.
This makes trade lane profitability easier to compare across the logistics network.
Compare Shipment Activity with Trade Lane Profitability
High shipment activity becomes more meaningful when it is viewed alongside financial performance.
The dashboard tracks shipment volume and revenue analysis across trade lanes, assisting logistics companies in determining whether increased freight movement is resulting in improved business results.
A lane may show growing shipment activity while gross profit remains relatively flat. Another route may carry fewer shipments but generate a stronger financial contribution.
Reviewing these measures together helps answer:
- Are higher shipment volumes producing higher gross profit?
- Which busy routes generate weaker returns?
- Which lanes combine healthy shipment activity with strong financial performance?
- Is the business processing more shipments without a similar improvement in gross profit?
This gives operations and commercial teams a more complete view of trade lane performance than shipment activity alone.
Understand Complete Origin-to-Destination Route Performance
Origin and destination data become more useful when analyzed as a connected route.
A company may have several important origin and destination markets, but management still needs to understand which country-to-country combinations are producing the strongest results.
The CargoWise Trade Lane Dashboard enables origin-to-destination analysis, allowing users to compare complete trade lanes rather than reviewing origin and destination data independently.
This makes it easier to identify:
- Strong-performing country pairs
- Routes with growing shipment activity
- Trade lanes generating strong gross profit
- High-volume routes with weaker financial contribution
- Origin-destination combinations requiring closer review
This route-level analysis gives management a clearer understanding of how individual corridors contribute to the wider freight network.
Understand Where Your Strongest Geographic Markets are
Trade lane performance can also be reviewed beyond individual country pairs.
Country and continent analysis helps management understand how shipment activity and financial contribution are distributed across the logistics network.
A region may account for a large share of freight volume, while another may contribute stronger gross profit. The dashboard allows users to compare trade lane performance across countries and continents and then narrow the analysis to the relevant routes.
This helps logistics companies distinguish between overall geographic activity and the specific trade lanes creating business value.
It can also show whether performance is concentrated in particular markets or whether other regions are becoming more significant.
See Which Products Contribute to Trade Lane Performance
A trade lane is not necessarily driven equally by every logistics product.
One route may show strong activity from a particular freight product, while another product contributes relatively little to the same corridor.
The dashboard allows users to compare product contribution across trade lanes.
This helps management understand:
- Which products contribute most to particular routes
- Whether trade lane growth is concentrated in one product
- Which route-product combinations perform strongly
- Where product contribution differs between markets
Instead of stopping at the overall result, commercial teams can identify which products are contributing to trade lane growth and where further analysis may be worthwhile.
Move from a Network-Level Result to the Route Behind It
An overall result can show that performance has changed, but management still needs to identify where that change came from.
The Trade Lane Dashboard allows users to narrow the analysis using company, product, year, month, origin, destination, country, and continent filters.
If gross profit falls across part of the network, users can narrow the view to identify the affected geography, route, company, product, and reporting period. Conversational BI can support this investigation further. Users can ask which trade lanes generated the strongest gross profit or which routes declined, then continue with follow-up questions about the relevant product, company, origin, or destination.
This helps turn a broad network change into a focused CargoWise trade lane analysis.
Compare Trade Lane Contribution Across Companies
For logistics groups operating more than one company or business entity, overall trade lane results can hide differences between individual companies.
The same route may contribute strongly in one company while showing lower shipment activity or financial contribution in another.
Company-level analysis allows management to compare how different entities contribute to the same trade lane and determine whether route performance is distributed across the organization or concentrated within one company.
Combined with product, origin, destination, and financial analyzes, this provides leadership with a clearer view of commercial performance across the logistics network.
Track How Trade Lane Performance Changes Over Time
A strong trade lane today may not remain strong indefinitely.
Shipment activity, revenue, cost, and gross profit can change as customer demand and business activity shift.
The dashboard allows users to analyze trade lane results by year and month, helping management identify:
- Routes gaining shipment activity
- Trade lanes losing volume
- Revenue changes across periods
- Cost movements affecting financial performance
- Routes where gross profit is improving or declining
Looking at the same trade lane over time helps management distinguish between a temporary movement and a continuing performance trend.
This is particularly useful when reviewing routes that have historically contributed significantly to the business.
Conclusion
Trade lane performance is about more than identifying where freight moves.
A route that handles the most shipments may not generate the strongest financial return, while a smaller origin-to-destination corridor may contribute greater business value.
WiseBI’s CargoWise Trade Lane Dashboard connects revenue, cost, gross profit, shipment volume, shipment count, origin-destination performance, geographic analysis, product contribution, company performance, and time-based trends in one view.
This helps logistics companies understand which routes generate strong financial results, where shipment activity is growing, which countries and products are contributing to performance, and which trade lanes require closer investigation.
Schedule a free demo with us today to see how the CargoWise Trade Lane Dashboard can help your team analyze trade lane profitability, compare origin-to-destination performance, and understand which routes are creating the strongest business value.