“Better decisions start with better visibility.”
Logistics and supply chain companies generate large amounts of data every day. The challenge is that this information is often spread across different modules, reports, systems, and spreadsheets.
When data is fragmented, decision-making slows down.
Teams may know that the information exists, but they still have to find it, combine it, validate it, and interpret it before they can act.
That is where data visibility becomes important.
For logistics companies, better data visibility means having a clear and connected view of operational and financial performance without constantly switching between separate reports. BI dashboards support this by bringing business data together, organizing it around relevant KPIs, and making it easier for teams to understand what is happening across the organization.
What is Data Visibility in Logistics?
Data visibility is the ability to access and understand relevant business information across logistics operations from a clear and connected view.
It goes beyond simply having access to data.
A logistics company may already have shipment records, finance reports, customer data, warehouse information, and operational KPIs available in different places. But if users need to search through multiple reports to understand overall performance, visibility is still limited.
Strong data visibility gives teams a more complete view across areas such as:
- Shipment activity
- Customer performance
- Warehouse Performance
- Revenue
- Cost
- Gross Profit
- Branch performance
- Transport modes and lanes
- Operational KPIs
- Employee productivity
The important part is not how much information is available.
It is whether teams can understand the information without spending unnecessary time finding and combining it.
CargoWise itself is designed around connected logistics operations, bringing forwarding, customs, warehousing, transport, accounting, and other functions into a single global platform. It also emphasizes shared access to logistics data as a way to improve visibility and responsiveness.
BI dashboards build on that data by turning it into a more analytical view of business performance.
Why does Data Visibility Matter for Logistics Decision-Making?
Logistics businesses operate through several connected functions.
Operations, finance, customer service, warehousing, transport, and management may all depend on information generated from the same shipment or customer activity.
When each team works from separate reports, it becomes difficult to understand the complete business picture.
Data visibility helps reduce this gap.
It allows teams to see both operational activity and business outcomes in a connected environment. This helps decision-makers understand not only what is happening but also which areas require attention.
How do BI Dashboards Improve Data Visibility?
BI dashboards improve data visibility by transforming raw operational and financial information into structured, interactive views.
Instead of requiring users to manually open several reports, dashboards bring relevant KPIs and business dimensions into one place.
For logistics companies, this can include data related to:
- Shipments
- Customers
- Revenue and Cost
- Gross Profit
- Branches
- Trade lanes
- Transport modes
- Warehouse activity
- Operational performance
- User productivity
A BI dashboard becomes a central analytical layer where users can review performance without repeatedly collecting information from separate sources.
Consolidating Data Across Different Logistics Functions
One of the biggest benefits of BI dashboards is the ability to consolidate data.
Logistics companies often work across multiple operational areas, and each area can generate its own reporting data.
Without consolidation, teams may rely on separate reports for forwarding, finance, warehouse activity, customs operations, transport, and customer performance.
BI dashboards bring these datasets together based on shared business dimensions.
That could include:
- Customer
- Branch
- Shipment
- Job
- Department
- Transport mode
- Product
- Trade lane
- Reporting period
This creates a connected analytical environment rather than a collection of isolated reports.
Creating a Single View of Business Performance
A major visibility problem in logistics is that different teams often look at different versions of performance.
Operations may focus on shipment activity.
Finance may focus on revenue and gross profit.
Commercial teams may focus on customers.
Management may need all three.
BI dashboards bring these perspectives together.
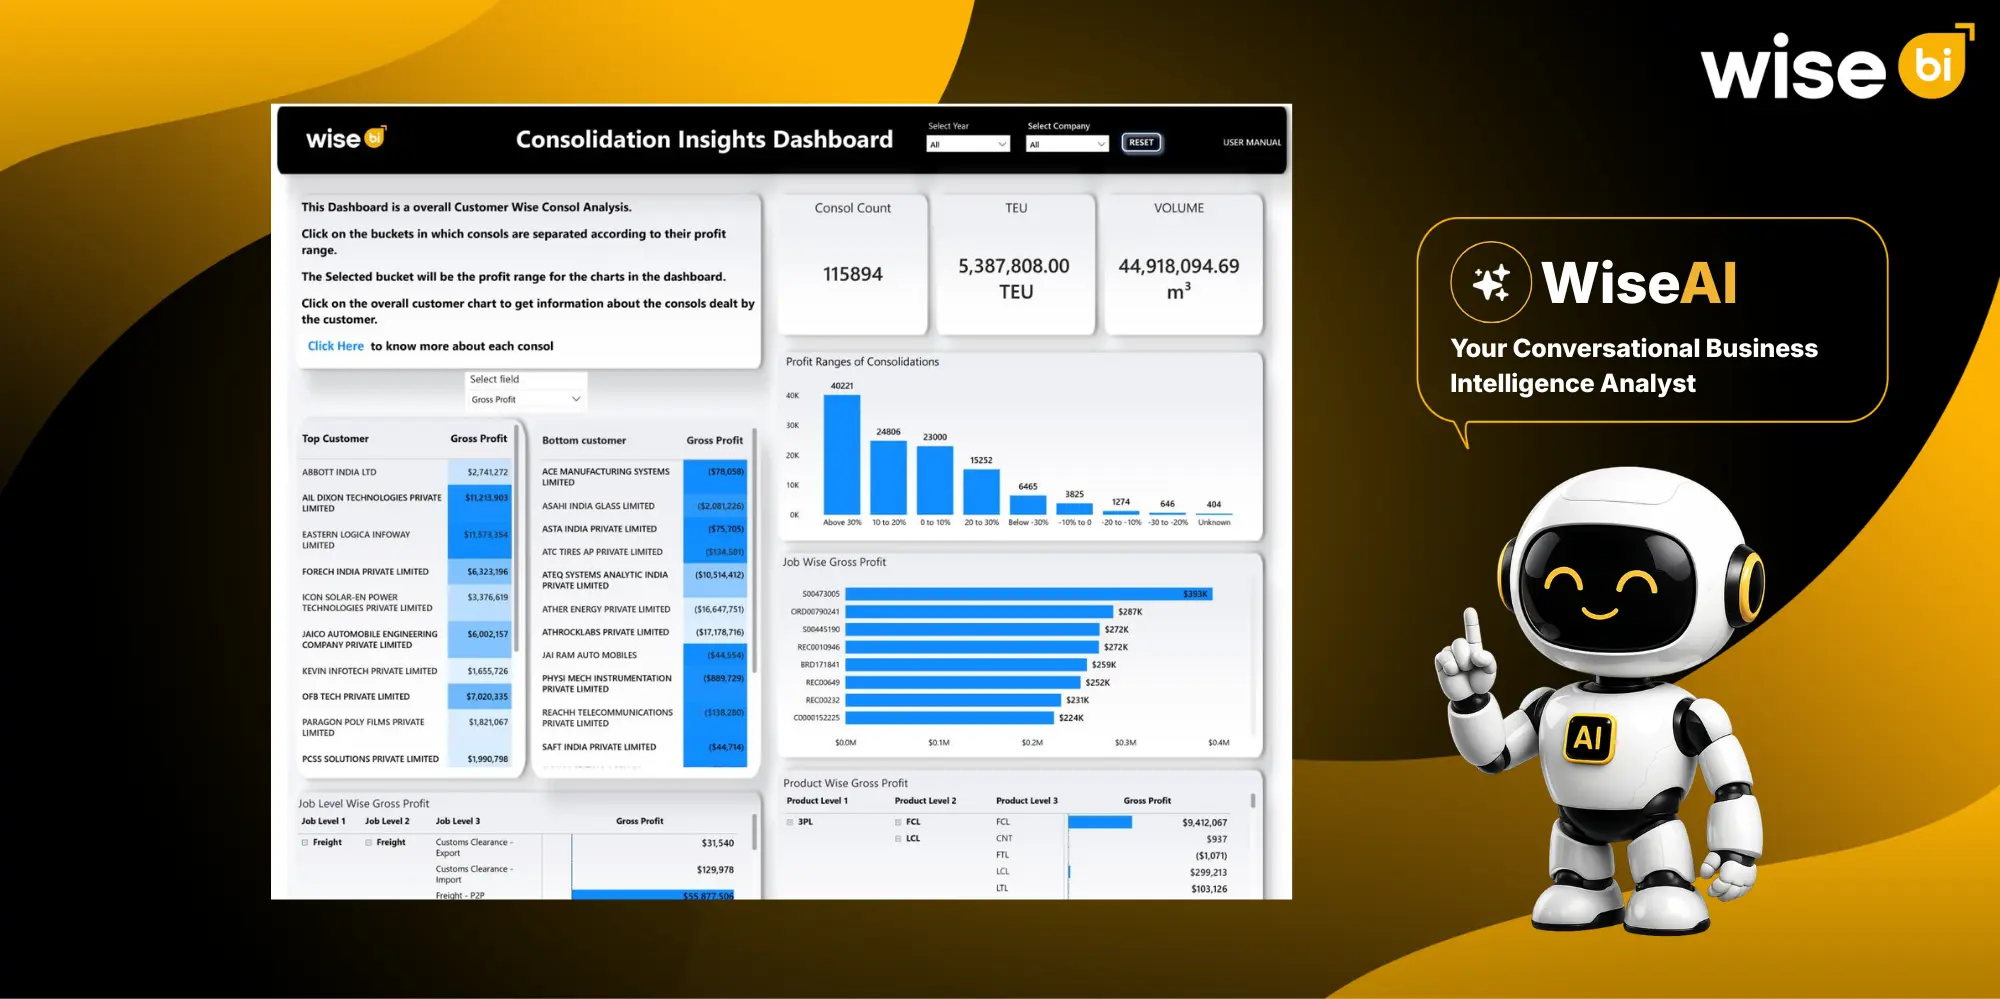
A single dashboard environment can display operational, financial, customer, and performance data in one place.
This helps teams work from a shared view instead of comparing multiple files or reports.
It also reduces the possibility of different departments using different calculations or reporting periods for the same KPI.
Connecting Operational and Financial Data
Data visibility becomes much more valuable when operational activity and financial performance are viewed together.
Shipment volume alone does not show profitability.
Revenue alone does not show cost efficiency.
Customer activity alone does not show margin contribution.
BI dashboards help connect these areas.
For logistics companies, common combined metrics include:
- Shipment volume
- Revenue
- Cost
- Gross Profit
- Gross Profit %
- Customer profitability
- Branch profitability
- Trade lane performance
- Service performance
This helps decision-makers evaluate business performance more completely rather than treating operations and finance as separate reporting areas.
Improving Visibility Through Interactive Filters
Static reports usually present a fixed view.
BI dashboards provide more flexibility through filters and interactive controls.
Users can review the same dataset from different perspectives without creating a new report.
Common filters can include:
- Company
- Branch
- Customer
- Transport mode
- Product
- Department
- Reporting period
This allows different users to focus on the information relevant to their responsibilities and makes the same dashboard useful across multiple management levels.
Using Drill-Down to See More Detail
High-level KPIs are useful for understanding overall performance.
But decision-makers often need more detail.
BI dashboards improve visibility by allowing users to drill down from summary information into more specific data.
Users can move from company-wide performance to branch, customer, service, shipment, or job-level detail.
This makes it easier to understand where changes are happening without relying on another report.
Drill-down capability also helps management maintain one consistent analytical view while still allowing different teams to explore the level of detail they need.
Improving Visibility Through Automated Reporting
Manual reporting can limit visibility because information is only available after someone prepares it.
BI dashboards reduce this dependence.
Once the underlying data connections, KPI definitions, and reporting models are configured, dashboard information can refresh according to the reporting setup.
Teams no longer need to repeatedly export data, update spreadsheets, recreate formulas, and rebuild charts.
This creates a more consistent reporting process and gives users access to updated information with less manual effort.
For logistics companies, automated reporting also means operational and financial visibility is less dependent on individual employees preparing reports.
Monitoring Logistics KPIs More Consistently
BI dashboards help logistics teams monitor important KPIs such as shipment activity, delays, job status, revenue, cost, gross profit, customer performance, branch performance, and warehouse activity from one central view.
WiseBI’s KPI and performance dashboards are designed to compare operational KPIs against targets and previous-period performance while allowing users to analyze results across business dimensions.
Consistent KPI visibility helps teams identify changes without depending on manual review of individual reports.
Improving Visibility Across Customers and Services
Customer visibility is another important area for logistics companies.
A customer relationship may span different transport modes, branches, services, shipments, and financial results.
BI dashboards help combine these views.
Teams can analyze customer performance based on:
- Shipment activity
- Revenue contribution
- Cost
- Gross Profit
- Profit margin
- Service usage
- Transport mode
- Trade lane activity
- Historical performance
This gives commercial and management teams a broader understanding of customer performance.
The same approach can be applied to branches, services, transport modes, and trade lanes.
Making Data Easier for Different Teams to Use
Data visibility is only useful if people can understand the information.
A technical report may contain accurate data but still be difficult for business users to interpret.
BI dashboards organize information through visual elements such as:
- KPI cards
- Tables
- Trend charts
- Comparisons
- Interactive filters
- Drill-down views
This helps operations managers, finance teams, commercial teams, and executives access the same underlying data through views that are easier to understand.
The goal is not to show more data.
It is to make the right data easier to use.
Reducing Dependence on Spreadsheets
Spreadsheets remain useful for many tasks, but relying on them as the main reporting environment can create visibility problems.
Separate files may contain:
- Different reporting periods
- Different formulas
- Outdated data
- Duplicate information
- Manual errors
- Multiple versions of the same report
BI dashboards provide a centralized reporting structure.
Once calculations and KPI definitions are established, users can access the same reporting logic consistently.
This helps improve data visibility across teams and reduces the time spent reconciling different spreadsheet versions.
Conclusion
From data to improved business visibility. Logistics companies already generate the data needed to understand most of their business performance.
The bigger challenge is making that information visible in a way that supports decision-making.
BI dashboards help by consolidating data across functions, connecting operational and financial information, automating reporting, supporting KPI monitoring, and letting users filter and drill into performance from one analytical environment.
Better data visibility does not mean giving teams more reports. It means giving them a clearer view of the information they already have.
Are you ready to improve visibility into your logistics and supply chain data? Schedule a free demo with WiseBI to see how connected BI dashboards can improve your teams’ understanding of business performance.