CargoWise is built to bring global logistics operations together on one platform. Freight forwarding, customs, warehousing, transport, accounting, documentation, and enterprise functions can all generate valuable operational and financial data within the same environment.
But having connected operational data does not automatically mean every decision-maker has a clear business view.
Operations teams may focus on shipment activity. Finance may concentrate on revenue, cost, and gross profit. Commercial teams may look at customers and trade lanes, while management needs to understand all these areas together.
This is where the CargoWise BI solution adds value
They bring CargoWise data from different functional areas into a structured analytical layer, helping freight forwarders compare performance, monitor KPIs, connect operational activity with financial results, and make more data-driven decisions.
What does CargoWise Data Integration Mean for BI Dashboards?
CargoWise data integration in BI means using information generated across different logistics functions and organizing it into connected dashboard views.
CargoWise supports integrated workflows across international forwarding, customs and compliance, warehousing, landside, transport, accounting, and enterprise functions.
A CargoWise BI dashboard builds on this foundation by organizing information around shared business dimensions such as:
- Customer
- Shipment
- Job
- Branch
- Transport mode
- Product or service
- Trade lane
- Reporting period
These shared dimensions allow freight forwarders to analyze information from multiple functions within one analytical environment.
What CargoWise Data can BI Dashboards Bring Together?
Freight forwarding performance depends on more than shipment movement alone. BI dashboards can bring together information from several CargoWise functions to create a broader management view.
Integrating Freight Forwarding Activity into a Management View
CargoWise forwarding workflows include bookings, jobs, air, ocean, road, and rail movements; milestones; documentation; rates; and other forwarding activity.
BI dashboards can organize this information into views covering shipment volume, job activity, transport modes, service mix, origins, destinations, and trade lanes.
This gives operations and management teams clearer visibility into how freight is moving across the business.
Connecting Accounting and Financial Data with Operational Performance
Operational performance becomes more valuable when it is connected with financial results.
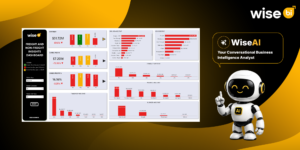
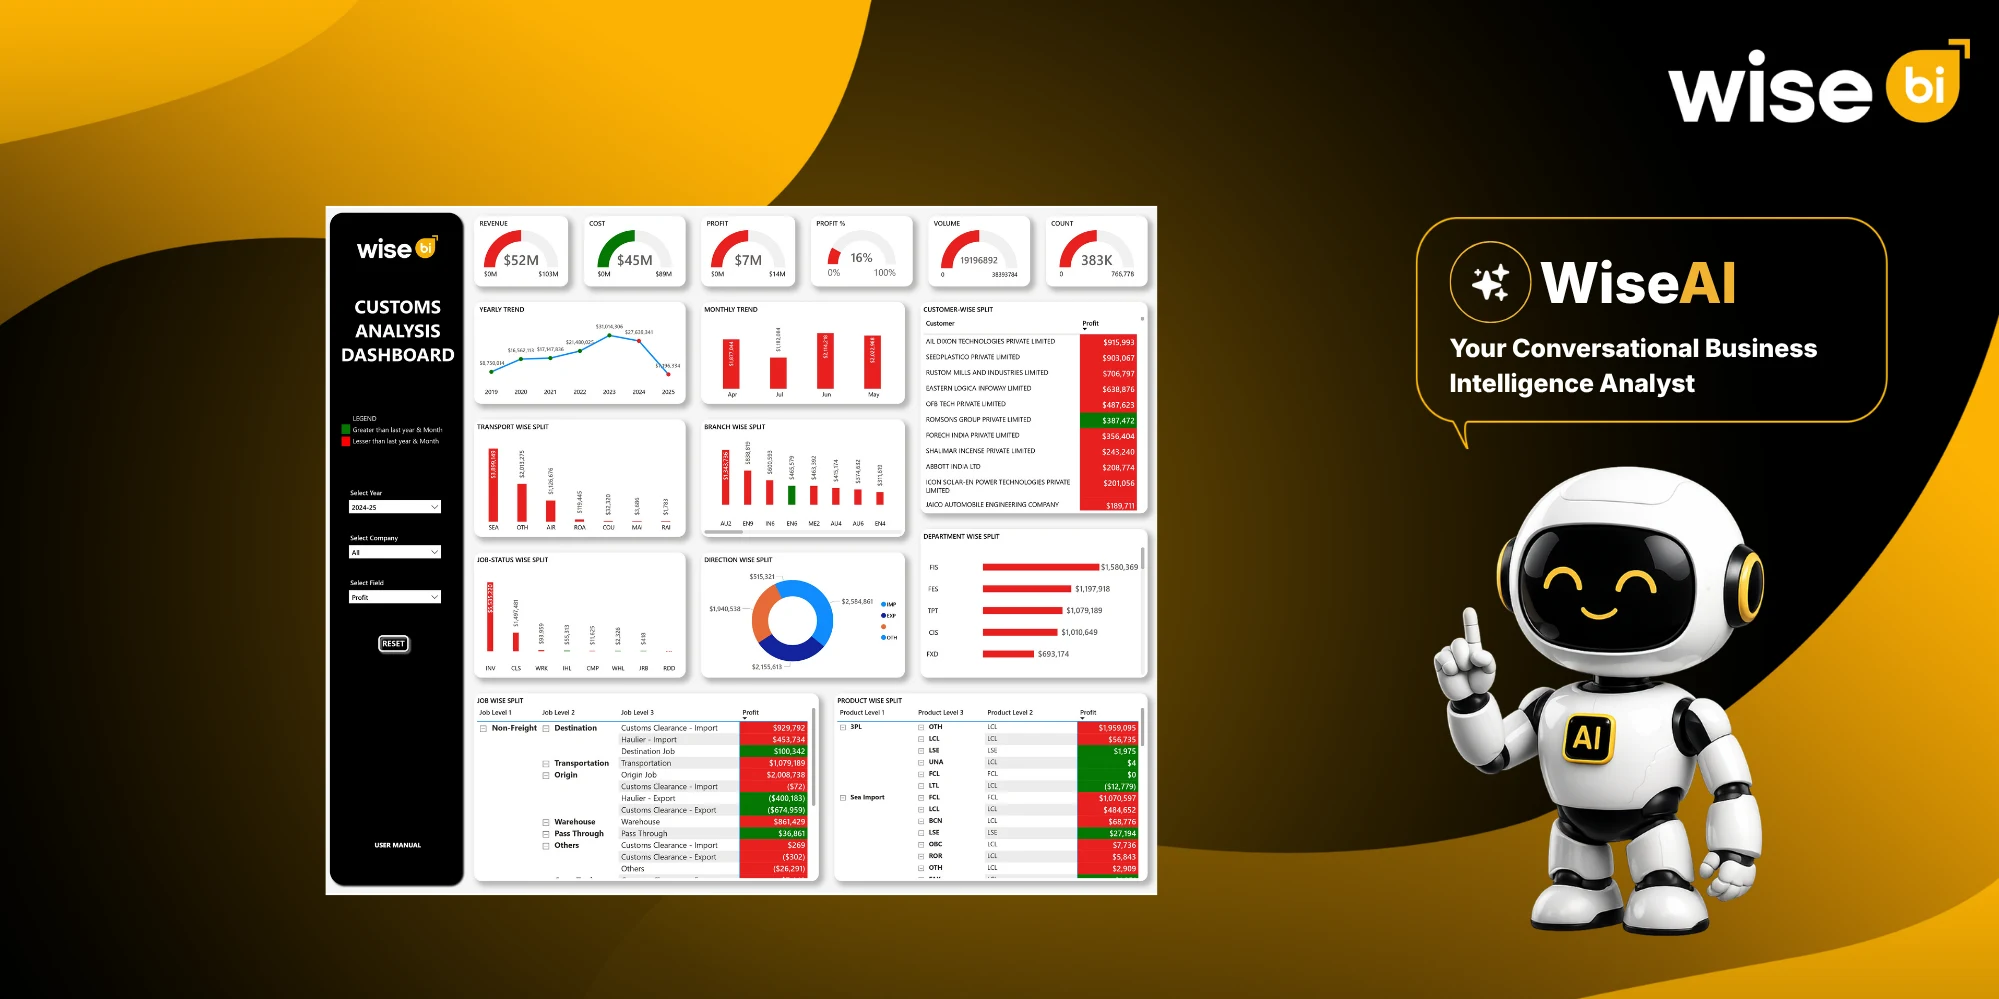
CargoWise Financial Operations Dashboards can display metrics like revenue, cost, gross profit, gross profit percentage, job profitability, customer profitability, branch profitability, and company finance overview.
This allows freight forwarders to understand not only how much activity is being handled but also what that activity contributes financially.
Bringing Customs and Compliance Data into Business Analysis
Customs workflows generate important information around declarations, documentation, compliance activity, shipments, and clearance processes.
Including relevant customs information in BI reporting gives teams greater visibility into clearance activity and related operational performance without reviewing customs data separately from forwarding operations.
Associated Warehouse Activity with Broader Logistics Performance
Warehouse operations generate data around inbound movements, outbound activity, inventory, receivals, consolidation, picking, and dispatch.
WiseBI’s CargoWise warehouse dashboards can organize this information alongside shipment, customer, and location data, helping freight forwarders understand warehouse performance within the wider logistics process.
Bringing Transport and Landside Data into Operational Analysis
Transport activity can include delivery planning, capacity, routes, ETA information, and inland container movements.
Connecting this information with BI dashboards allows teams to include transport performance within wider logistics analytics rather than treating it as a completely separate reporting area.
Interlinking Other Business Data with Overall Performance
BI dashboards can also combine other relevant business data, including sales activity, customer information, workforce data, and external operational sources.
Bringing these into the same analytical environment gives freight forwarders a broader understanding of overall business performance.
For organizations that need to integrate information beyond standard CargoWise reporting, custom BI development can support connections between CargoWise and other business systems.
How do BI Dashboards Connect CargoWise Data Across Modules?
BI integration is not simply about displaying several CargoWise reports on one screen. The information needs to be organized around common business relationships.
For example, a shipment may be connected to a customer, job, branch, transport mode, revenue, cost, and gross profit.
Once these relationships are structured correctly, the same underlying information can support several analytical views.
A BI layer can connect relationships such as:
Shipment → Customer → Revenue → Cost → Gross Profit
Branch → Jobs → Shipment Activity → Financial Performance
Trade Lane → Volume → Customers → Revenue → Margin
Warehouse Activity → Shipment → Customer → Business Performance
This allows freight forwarders to go beyond standalone module reporting and analyze how different areas of the business interact with one another.
Creating One Business View Instead of Separate Department Reports
Different departments naturally focus on different information.
Operations may monitor jobs and shipment movement. Finance may review revenue, cost, and gross profit. Commercial teams may focus on customers and trade lanes. Leadership needs a broader view across all these areas.
A CargoWise dashboard enables these teams to work with connected underlying data while also viewing KPIs relevant to their roles.
This reduces the need for independently prepared spreadsheets and provides management with a more consistent view of operational, commercial, and financial performance, while role-based access ensures that the right information is available to the right people.
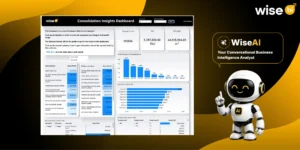
WiseBI’s wider CargoWise BI dashboard library brings together dashboards for operations, finance, customers, warehouses, branches, and productivity, allowing different business functions to work from more consistent analytical views.
Connecting Shipment Activity with Profitability
Shipment volume is an important operational measure, but it does not provide a complete picture of business performance.
BI dashboards can connect shipment activity with:
- Revenue
- Cost
- Gross profit
- Profitability trends
- Customers
- Countries
- Products
- Job types
- Transport modes
WiseBI’s CargoWise shipment and volume analysis dashboards bring shipment activity together with customer performance, geography, service mix, revenue, cost, and job profitability.
This helps freight forwarders understand how operational activity contributes to financial performance.
Improving Cross-Module CargoWise KPI Visibility
Once CargoWise data is connected, businesses can monitor important KPIs through a more consistent reporting structure.
These may include shipment count, revenue, cost, gross profit, job activity, customer performance, branch performance, trade lane performance, warehouse activity, operational exceptions, and service performance.
Rather than reviewing these measures through separate functional reports, management can compare them within a connected dashboard environment.
A dedicated CargoWise KPI and Performance Dashboard can support this by helping logistics teams compare operational performance against targets, previous periods, and other business dimensions.
This makes it easier to identify where performance is improving, declining, or requires further investigation.
Using Filters and Drill-Down for Deeper CargoWise Analytics
A key advantage of interactive BI dashboards is the ability to analyze the same dataset from multiple perspectives.
Users may filter data by:
- Branch
- Customer
- Transport mode
- Product
- Trade lane
- Country
- Reporting period
Depending on the dashboard structure, they can also move through different levels of detail, such as:
Company → Branch → Customer → Shipment → Job
This allows management to begin with a high-level KPI and investigate the underlying activity contributing to that result.
Instead of requesting another spreadsheet whenever a question becomes more specific, users can continue analyzing the connected CargoWise dataset.
Reducing Manual CargoWise Reporting and Data Consolidation
Even when operational information is available in CargoWise, management reporting can still involve manual work if teams regularly export data into spreadsheets.
That process can involve:
- Downloading separate reports
- Combining datasets
- Updating formulas
- Reconciling figures
- Rebuilding charts
- Checking multiple file versions
A connected CargoWise reporting dashboard reduces this repetitive consolidation by applying established data relationships, calculations, and KPI logic.
Once the required reporting structure is configured, dashboards can refresh according to the reporting setup. This allows teams to spend less time preparing reports and more time analyzing what the information means for the business.
How does Integrated CargoWise Data Support Data-Driven Decisions?
The value of integrated CargoWise data becomes clearer when teams use it to answer business questions rather than simply view more reports.
Freight forwarders can use connected BI dashboards to compare operational and financial performance, understand customer contribution, review branch and service performance, analyze shipment profitability, monitor trade lanes, and track KPIs more consistently.
They can also help management identify changes in performance earlier and investigate the underlying customers, jobs, shipments, branches, or services contributing to those results.
As a result, decision-making can rely more on connected business information and less on manually consolidated reports from different departments.
Conclusion
CargoWise provides freight forwarders with an integrated platform for managing key logistics operations. The real value comes from understanding how operational activity, customer performance, financial results, and KPIs connect across the business.
BI dashboards build on CargoWise data by bringing forwarding, finance, customs, warehouse, transport, customer, and profitability insights into one clear business view.
Ready to get more value from your CargoWise data? Schedule a free demo with WiseBI and see how connected BI dashboards can help your freight forwarding business gain clearer insights and make faster, data-driven decisions.