


Customer Base
Monitor customer distribution across business segments.

Curated dashboards plus predictive insights that recommend your next move
Insights, playbooks and product thinking from the Wise BI team.

Benchmark the financial and operational value of every customer across your logistics business.


The Problem
Customer profitability and operational data are often scattered across spreadsheets and multiple reports. Consolidating this information manually is time-consuming, making it difficult to compare customer value, benchmark performance, and identify commercial opportunities.

Financial and operational metrics are stored across disconnected reports.

Manual reporting delays customer comparisons and performance analysis.

Different reports often produce conflicting customer information.

High-value and low-performing customers are difficult to identify quickly.
Solution: Clear visibility into customer value performance.
Capability Overview
The Per Customer Analysis Dashboard provides a complete benchmark of customer value by combining financial performance, operational activity, and customer segmentation into one connected view. Instead of reviewing manually prepared reports, leadership can compare the average financial and operational contribution of every customer, enabling faster and more confident commercial decisions.


Understand the financial value generated by every customer.
 Measure average gross profit per customerCompare profitability across customer segmentsBenchmark financial contribution

Evaluate the performance of different customer groups.
Compare SME, Corporate, and Unclassified customersAnalyze customer distributionMeasure segment performance

Benchmark operational contribution across every customer.
Compare FCL, LCL, and Air activityReview freight movementsAnalyze origin and destination averages

Assess the strength of your customer portfolio.
Compare profit-making and loss-making customersIdentify high-value customer groupsSupport commercial planningMetric Index
Benchmark customer financial and operational performance from portfolio summary to segment-level detail.
Customer Base
Monitor customer distribution across business segments.
Average Customer Value
Measure the average gross profit generated per customer.
Customer Profitability
Compare profit-making and loss-making customer groups.
Segment Performance
Evaluate SME, corporate, and unclassified customer benchmarks.
Operational Benchmarks
Review average freight, shipment, origin, and destination activity per customer.
Portfolio Quality
Measure the overall strength and balance of your customer portfolio.
Who Benefits from this Dashboard?

Gain a complete view of customer value and portfolio performance.

Benchmark customer segments and identify profitable growth opportunities.

Monitor customer profitability and financial contribution with confidence.

Strengthen customer relationships using performance-driven insights.
The Per Customer Analysis Dashboard gives leadership a connected view of customer profitability, operational performance, and business segmentation. Instead of viewing multiple reports benchmarking every customer consistently, organizations can improve commercial strategies, strengthen customer relationships, and maximize long-term business value.
Key Outcomes:
 Compare customer profitability across business segments.Measure average gross profit generated per customer.Identify profit-making and loss-making customer groups.Benchmark operational performance for every customer.Evaluate SME, corporate, and unclassified customer segments.Monitor portfolio quality through connected business insights.Prioritize commercial investments using customer benchmarks.Use WiseAI to investigate customer trends, profitability patterns, and commercial opportunities through natural-language analysis.

"Every customer benchmark creates an opportunity to improve business performance."
Benchmarks every customer using both financial and operational performance indicators.Combines profitability, operational activity, and customer segmentation in one executive dashboard.Compares customer performance across SME, corporate, and unclassified segments.Measures average customer contribution across freight, shipment, origin, and destination activities.Enables rapid identification of profit-making and loss-making customer groups.Interactive drill-downs across customer segments, reporting periods, and operational metrics.Pre-mapped with CargoWise operational data for seamless customer performance reporting.WiseAI enables natural-language analysis of customer value, portfolio performance, and commercial opportunities.Blogs, newsletters and case studies on CargoWise Per Customer Analysis Dashboard.
 Blog
Blog
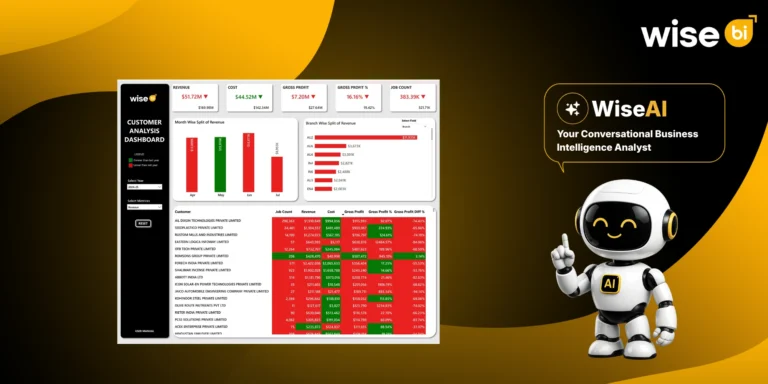
A customer can generate a lot of jobs and still deliver weaker financial value than expected. That is why freight forwarders need to look…
 Blog
Blog
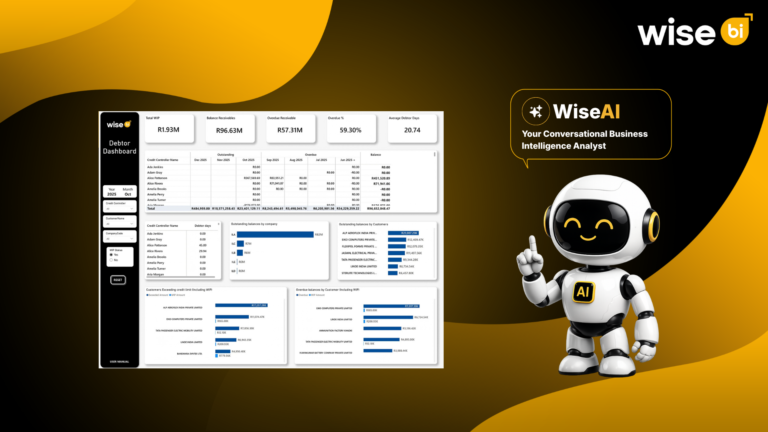
Revenue is recorded when the invoice is raised, but cash flow improves only when the customer pays. A completed freight job does not mean…
 Blog
Blog
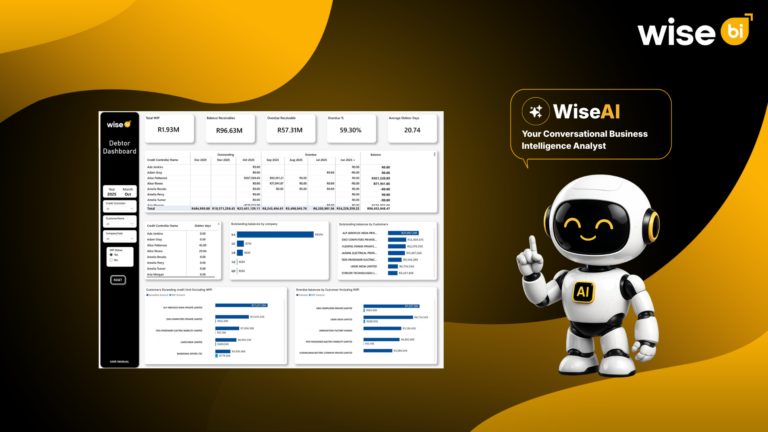
For a freight forwarder, completing a shipment and issuing an invoice are only part of the financial cycle. The job truly turns into cash…
Compare customer profitability across SME, corporate, and unclassified groups to identify the segments generating the strongest business value.
Measure average gross profit per customer to understand which customer groups deliver the greatest financial contribution.
Analyze average FCL, LCL, Air, freight, origin, and destination activity to compare operational contribution across customer segments.
Yes. The dashboard benchmarks profitable and loss-making customer groups, enabling leadership to improve commercial strategies and portfolio performance.
WiseAI helps uncover customer profitability trends, compare business segments, investigate performance patterns, and identify commercial opportunities using natural-language questions.