


Cashless Debt Balance
Assess whether available cash is sufficient to offset debt obligations.

Curated dashboards plus predictive insights that recommend your next move
Insights, playbooks and product thinking from the Wise BI team.

Understand your financial position across assets, liabilities, debt, liquidity, and capital efficiency in one connected view.


The Problem
Balance sheet data is often buried within complex account hierarchies and separate entity reports, making it difficult to understand liquidity, debt exposure, capital efficiency, and overall financial strength.

Assets, liabilities, equity, receivables, borrowings, and payables are spread across multiple reporting levels.

Cash, debt, and short-term obligations are difficult to assess without a consolidated financial position.

ROCE and ROIC are rarely reviewed alongside debt and tangible net worth.

Comparing balance sheet positions across countries, currencies, months, and reporting periods requires extensive manual work.
Solution: Clear balance sheet intelligence for control.
Capability Overview
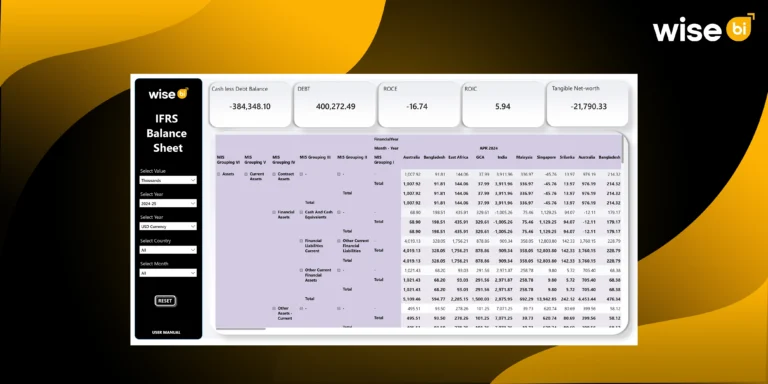
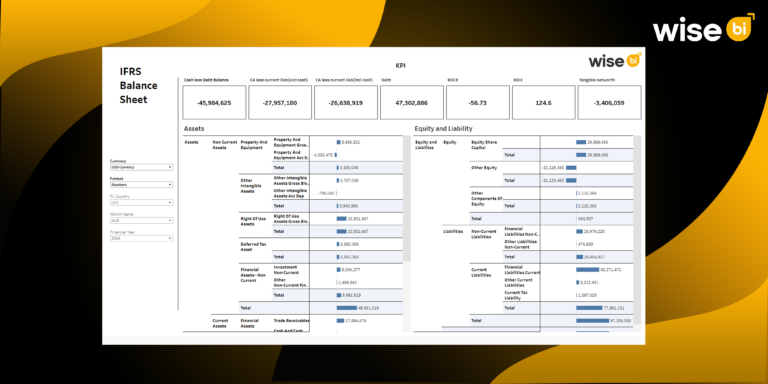
The IFRS Balance Sheet Dashboard combines executive financial health indicators with detailed asset, equity, and liability hierarchies in one connected workspace. Instead of relying on complex balance sheet reports, leadership gains real-time financial position intelligence to assess risk, understand funding structure, and make more informed capital decisions.


Assess the relationship between available cash and financial obligations.
 Monitor cash-less debt balanceReview total debtEvaluate liquidity pressure

Understand how effectively invested capital supports business returns.
Track ROCEMonitor ROICAssess capital returns

Review how financial resources are distributed across the business.
Analyze current assetsReview cash and cash equivalentsMonitor trade receivables and other financial assets

Understand how business assets are funded.
Review current liabilitiesAnalyze borrowings and trade payablesMonitor lease, contract, and other liabilitiesMetric Index
Assess liquidity, debt, and capital efficiency from executive summary down to account-level detail.
Cashless Debt Balance
Assess whether available cash is sufficient to offset debt obligations.
Debt Position
Monitor total debt and overall financial exposure.
Capital Efficiency
Evaluate ROCE and ROIC to understand returns on employed and invested capital.
Tangible Net Worth
Review the underlying financial strength of the organization.
Asset Position
Analyze current assets, receivables, cash, and other financial assets.
Liability Structure
Review borrowings, payables, lease liabilities, contract liabilities, and other obligations.
Who Benefits from this Dashboard?

Understand the organization's financial stability, debt position, and tangible value.

Review assets, liabilities, capital efficiency, liquidity, and IFRS reporting structures.

Monitor cash, debt, receivables, payables, and short-term financial obligations.

Compare financial positions across countries and reporting periods.
Our IFRS Balance Sheet Dashboard connects liquidity, debt, capital efficiency, assets, equity, and liabilities into one executive view. Instead of reviewing complex financial statements, leadership gains a connected view of financial position and capital strength.
Key Outcomes:
 Track a cashless debt balance and total debt.Evaluate ROCE and ROIC together.Review tangible net worth across reporting periods.Analyze current assets and financial assets.Monitor trade receivables and cash equivalents.Review borrowings, payables, and lease liabilities.Compare financial positions across countries and currencies.Use WiseAI to investigate balance sheet movements and financial risks faster.

"Every financial detail is designed to support stronger capital and risk decisions."
Connects executive financial health indicators with detailed IFRS balance sheet structures.Presents assets, equity, and liabilities through expandable MIS reporting hierarchies.Supports analysis by country, currency, month, year, and value scale.Brings liquidity, debt, capital returns, and tangible net worth into one workspace.Pre-mapped with CargoWise financial data to reduce manual report consolidation.Enables country-level comparison across financial statement categories.Provides both summary financial indicators and detailed account-level analysis.WiseAI supports natural-language balance sheet investigation.Blogs, newsletters and case studies on CargoWise IFRS Balance Sheet.
 Blog
Blog
Financial reporting in logistics can easily become complicated. Freight forwarders handle thousands of transactions between customers, carriers, overseas agents, vendors, and branches. With multiple…
 Newsletter
Every transaction recorded in CargoWise tells part of your financial story. From customer invoices and supplier costs to receivables, payables, assets, liabilities, and cash…
 Blog
Blog
Have you ever thought of being able to examine your company’s finances perspicaciously, seeing beyond the numbers to determine where you stand? Managing financial…
The IFRS Balance Sheet Dashboard includes cashless debt balance, debt, ROCE, ROIC, and tangible net worth to provide an executive view of financial strength.
Yes. Expandable IFRS and MIS hierarchies allow you to review current assets, financial assets, receivables, cash, borrowings, payables, lease liabilities, and other balance sheet categories.
Yes. Country filters and country-wise columns help leadership compare financial statement values across different markets.
Yes. The dashboard supports currency selection and value display options such as thousands or millions, along with year and month filters.
WiseAI helps users investigate liquidity, debt, capital efficiency, asset movements, and liability changes through natural-language questions.