


Total Jobs
Track the total number of operational jobs.

Curated dashboards plus predictive insights that recommend your next move
Insights, playbooks and product thinking from the Wise BI team.

Track the profitability of every logistics job and improve operational performance with confidence every single day.


The Problem
Thousands of logistics jobs move through your business every month. Without a unified view, identifying profitable jobs, loss-making jobs, and operational issues becomes slow and reactive.

Revenue, costs, and gross profit are often reviewed separately from operational execution.

Negative-margin jobs can remain hidden until financial reports are completed.

Jobs with no costs, no transactions, or incomplete financial activity are difficult to identify.

Comparing profitable and underperforming jobs requires multiple reports and manual investigation.
Solution: Real-time insight into job profit completeness.
Capability Overview
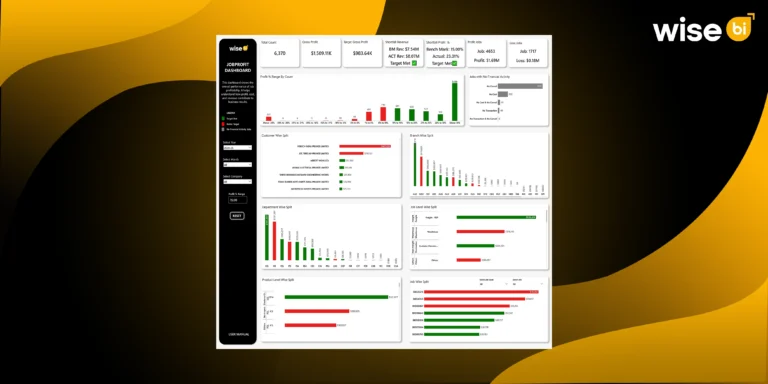
The Job Profit Dashboard combines financial performance and operational execution into one intelligent workspace. Instead of reviewing disconnected operational and financial reports, leadership gains real-time visibility into profitable jobs, operational risks, profit margins, and financial completeness.


Measure the financial performance of every logistics job.
 Track gross profitMonitor profit percentageReview profitable and loss-making jobs

Identify jobs requiring operational attention.
Review no-cost jobsMonitor no-transaction jobsIdentify incomplete financial activity

Understand how profitability is distributed across operations.
Analyze profit percentage rangesCompare the target versus the actual profitMeasure benchmark achievement

Discover where profitable jobs are generated.
Compare customersReview branches and departmentsAnalyze products and job levelsMetric Index
Monitor job-level profitability, targets, and financial completeness from summary to record level.
Total Jobs
Track the total number of operational jobs.
Gross Profit
Measure total gross profit generated from completed jobs.
Profit & Loss Jobs
Monitor jobs delivering positive and negative profitability.
Profit Percentage
Track actual profit percentage against benchmark targets.
Jobs with No Financial Activity
Monitor jobs without costs, transactions, or financial completion.
Job Profit Distribution
Analyze profitability across different profit percentage ranges.
Who Benefits from this Dashboard?

Monitor overall job profitability across the business.

Identify operational issues affecting job profitability.

Review gross profit, profit percentage, and financial completeness.

Monitor job performance and resolve operational bottlenecks faster.
Our Job Profit Dashboard connects financial performance, operational execution, customer activity, and organizational contribution into one executive view. Instead of waiting for month-end financial reviews, leadership gains real-time visibility into profitable jobs, operational gaps, and financial performance, enabling faster operational improvements.
Key Outcomes:
 Monitor profitable and loss-making jobs.Compare actual profit against benchmark targets.Identify jobs with missing financial activity.Review customer, branch, and department contribution.Use WiseAI to identify job-level trends and improvement opportunities.Analyze profitability by product and job level.Track profit percentage distribution across all jobs.Investigate operational bottlenecks affecting profitability.

"Every insight helps leadership improve profitability at the job level."
Interactive filtering by company, year, month, job, and job level.Highlights profitable, loss-making, and financially incomplete jobs.Combines operational job performance and financial profitability in one dashboard.Visualizes profit percentage distribution for faster analysis.Pre-mapped with CargoWise data for zero manual report consolidation.Drill down from summary metrics to individual job records.Clear visual indicators for operational and financial performance.WiseAI enables natural-language job profitability analysis.Blogs, newsletters and case studies on CargoWise Job Profit Dashboard.
 Newsletter
Every logistics company desires profitable jobs. The tricky part is that profitability is not always visible when revenue, cost, gross profit, customer contribution, branch…
 Blog
Blog
Every logistics operation rests on one question: Are we making a profit on this shipment job? The answer is frequently hidden in spreadsheets, emails,…
 Blog
Blog
Revenue is recorded when the invoice is raised, but cash flow improves only when the customer pays. A completed freight job does not mean…
The Job Profit Dashboard identifies profit-making jobs and ranks them by gross profit, helping you focus on your strongest operational performers.
Loss-making jobs are highlighted so you can investigate the operational or financial issues affecting profitability.
Yes. The dashboard highlights jobs with no costs, no transactions, no consolidation, or other missing financial activity.
Yes. Interactive views allow you to compare profitability across customers, branches, departments, products, and job levels.
WiseAI helps you investigate job performance, identify profitability trends, uncover operational issues, and ask questions using natural language.