Every logistics company desires profitable jobs.
The tricky part is that profitability is not always visible when revenue, cost, gross profit, customer contribution, branch performance, and job activity are spread across multiple reports.
A job may appear active. Revenue may appear to be strong. Shipments may be on the move. However, the real question is simple:
Is that job really profitable?
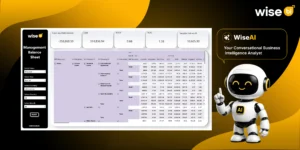
Here’s where the CargoWise JobProfit Dashboard comes in useful.
It consolidates key profitability data into a single view, allowing logistics teams to understand how revenue, cost, gross profit, customers, branches, departments, products, and job levels affect overall business performance.
💰 Why does Job Profitability Visibility Matter?
Revenue alone does not provide a complete picture of logistics.
A shipment may generate good revenue but produce a low profit if costs are high, billing is incomplete, charges are missing, or margins are below target.
Without a clear job profitability perspective, teams may struggle to identify
- 💸 Jobs that look busy but deliver low margin
- 📉 Loss-making jobs that need attention
- 🧾 Jobs with missing financial activity
- 👥 Customers creating margin pressure
- 🏢 Branches or departments performing below target
- 📦 Products or services not meeting profit expectations
The problem isn’t always poor performance. It is not always possible to see where performance is coming from.
📊 What does the CargoWise Job Profit Dashboard Show?
The CargoWise JobProfit Dashboard is intended to show the overall performance of job profitability. It enables teams to understand how profit, cost, and revenue influence business outcomes.
The BI dashboard offers users a comprehensive view of:
- Total job count
- Gross profit performance
- Target gross profit
- Actual profit percentage versus benchmark
- Profit jobs and loss jobs
- Jobs with no financial activity
- Customer-wise profit split
- Branch-wise profit split
- Department-wise split
- Product-level performance
- Job-wise profitability details
This enables leadership, finance, and operations teams to identify what is working, what is underperforming, and where action is required.
⚠️ The Hidden Risk of Profitability Blind Spots
Many logistics teams review profit after a job is completed, at the end of the month, or when finance prepares reports.
By then, the problem may have impacted margins.
Common profit blind spots include:
- Costs not captured correctly
- Revenue not aligned with actual cost
- Jobs with no transaction activity
- Low-margin jobs hidden inside high shipment volume
- Missing charges or incomplete billing
- Profit data is spread across multiple reports
Let’s be honest: margin leakage can occur quietly.
One missed charge, incorrect cost, or underpriced job can reduce profitability without raising an immediate red flag. That is why teams require faster access to job-level profit information.
🔍 Why does Drill-Down Visibility Matter?
High-level profit figures are useful, but they do not always explain the underlying cause of performance.
If a branch is underperforming, teams must identify which jobs, customers, departments, or products are causing the problem. If a customer appears profitable, teams must determine whether that profit is derived from all jobs or just a few high-value shipments.
Drill-down capability is especially useful in this situation.
It enables teams to move from the following:
“What’s the overall profit?”
to:
“What job, customer, branch, department, or product is causing this result?”
This saves time and allows teams to find the root cause more quickly than by manually comparing multiple reports.
🚀 Why does this Matter Now?
Logistics companies are under pressure to make quick decisions.
Costs are shifting. The margins are tighter. Customers’ expectations are higher. Teams must understand where profits are increasing and where they are leaking.
CargoWise already collects a significant amount of operational and financial information. However, if teams must generate multiple reports simply to understand profitability, the process becomes inefficient and reactive.
A Jobprofit Dashboard addresses this by converting CargoWise data into a simple performance view.
Instead of waiting for reports, teams can quickly assess profitability by job, customer, branch, department, and product.
📌 How can this Benefit CargoWise Users?
The JobProfit Dashboard simplifies profit analysis for CargoWise users by providing teams with a single, comprehensive view of financial performance.
It helps users:
- Identify profitable and loss-making jobs faster
- Track gross profit against target
- Understand whether profit benchmarks are being met
- Review customer profitability clearly
- Compare branch and department performance
- Understand product-level contribution
- Spot jobs with no financial activity
- Drill down into job-level details
This allows finance, operations, and management to work off the same numbers rather than relying on separate reports and manual comparisons.
✅ Quick Profitability Check
Take a minute and ask your team:
- Can you identify loss-making jobs quickly?
- Do you know which customers are driving the most profit?
- Can finance and operations see the same profit picture?
- Are jobs with no financial activity easy to detect?
- Can managers compare branch and department performance without multiple reports?
- Can your team drill down from overall profit to job-level detail?
If the answers are unclear, it’s possible that the issue isn’t with missing data. It may be lacking in profitability visibility.
🚀 Final Thoughts
Job profitability is one of the most important metrics in logistics. However, it cannot be managed effectively when data is dispersed, delayed, or difficult to interpret.
The CargoWise JobProfit Dashboard provides logistics teams with a clear view of revenue, cost, gross profit, customer contribution, branch and department performance, and job-level profitability.
Because increased profitability does not result from more reports.
It results from seeing the right numbers faster and acting on them with confidence. If your team is still spending too much time creating reports, comparing spreadsheets, or manually reviewing job profitability, it may be time to streamline the process.
The logistics BI solution can transform CargoWise job profit data into clear, actionable dashboards, allowing your team to monitor margins, identify loss-making jobs, improve visibility, and make better financial decisions daily.