


Freight consolidation can improve space utilization, reduce transportation costs, and help freight forwarders serve multiple customers more efficiently. However, managing and evaluating consolidation performance is not always straightforward.
A single consolidation may include several customers, jobs, products, revenue lines, costs, and supporting services. One consolidation may generate a strong margin, while another carrying a similar volume may lose money because of weak pricing, missed charges, rising costs, or excessive operational effort.
The main challenge is seeing the complete performance and profitability result clearly.
When consolidation information is spread across CargoWise reports, spreadsheets, finance summaries, and individual job records, your team may be able to determine how much cargo moved. However, it may still be difficult to identify which consolidations created value and which require further review.
What is a CargoWise Consolidation Insights Dashboard?
A CargoWise Consolidation Insights Dashboard is a business intelligence reporting solution built using consolidation data from CargoWise.
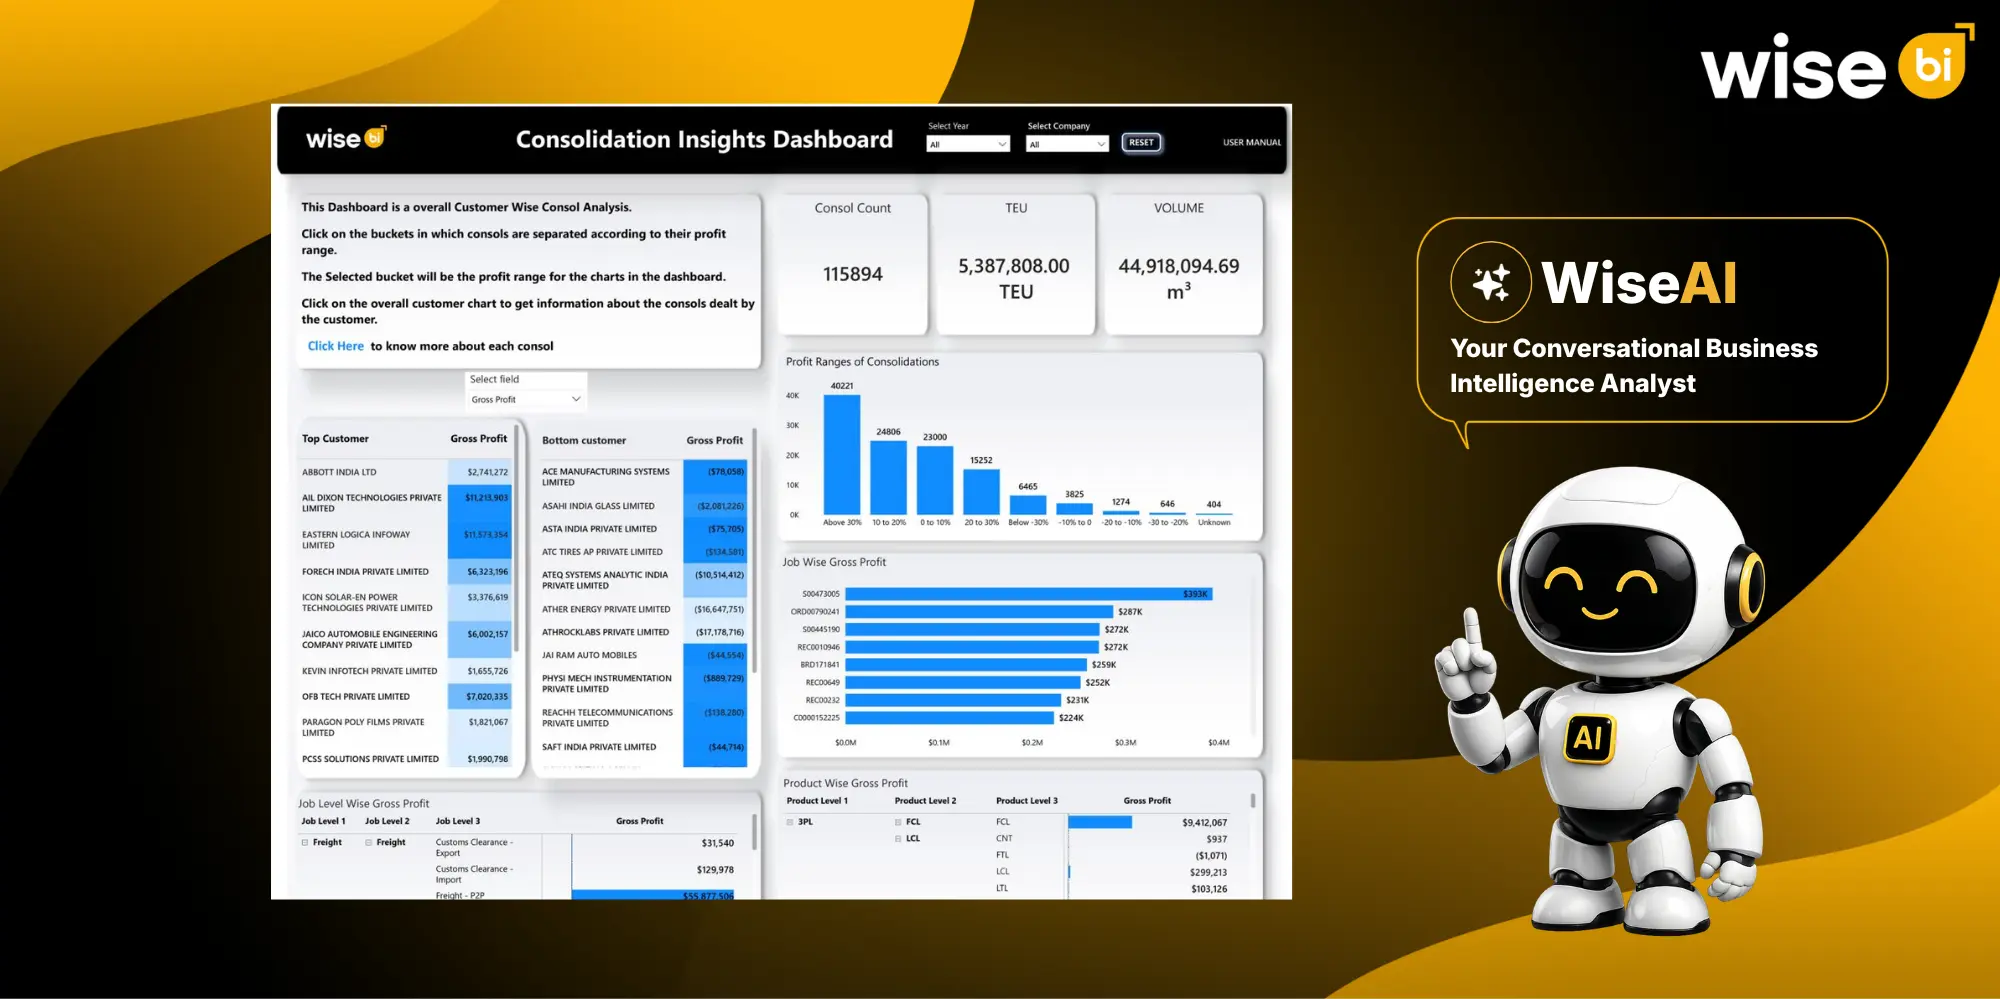
It brings relevant operational and financial information into a single visual reporting environment. This allows freight forwarders to review consolidation activity, profitability ranges, customer contributions, job and product performance, processing time, and individual consolidation details without repeatedly rebuilding reports.
The BI dashboard provides a comprehensive overview of consolidation activity, including:
- Consolidation count
- Cargo volume
- TEU volume
- Gross profit ranges
- Customer-wise gross profit
- Job-wise gross profit
- Product-wise gross profit
- Consolidation-level financial details
- Average consolidation days and hours
Users can filter the data by year, company, consolidation number, selected metric, and trade-lane country. They can also use the conversational business intelligence AI to ask questions in natural language, receive results more quickly, and expand the analysis through follow-up questions.
As a result, leadership teams can evaluate overall consolidation performance, while operations, finance, and commercial teams can focus on the information most relevant to their responsibilities.
Why is Evaluating Shipment Consolidation Performance Difficult?
A consolidation cannot be evaluated solely by the amount of cargo it transports.
A single consolidation may involve freight movement, customs clearance, warehouse handling, inland transportation, origin and destination services, and other operational activities. Revenue and costs may also be recorded across different jobs or stages of the shipment.
Because of this complexity, a busy consolidation may appear commercially successful even when its final margin is low.
Your team may struggle to answer important questions such as:
- Did the consolidation generate a healthy return?
- Which customer contributed most to the result?
- Which job or service generated the highest cost?
- Was all chargeable work billed?
- Which product delivered the strongest margin?
- Why did one consolidation perform better than another?
- How long did the consolidation remain open?
The BI dashboard connects operational and financial data, allowing users to navigate from a high-level view of shipment consolidation performance to the underlying details that influenced the outcome.
See How Consolidations Perform Across Profit Ranges
One of the dashboard’s primary views categorizes consolidations by profit range.
Instead of displaying only total gross profit, the BI dashboard separates consolidations into four categories: positive, low-margin, negative-margin, and unknown.
This helps freight forwarders assess the overall quality of their consolidation activity rather than relying only on a combined financial result.
For example, a company may achieve positive overall gross profit while still managing a significant number of weak or loss-making consolidations. Strong profits from a small number of consolidations may sometimes hide poor performance elsewhere.
Profit-range analysis allows managers to identify which consolidations may require immediate attention.
Users can focus on negative-margin consolidations and then investigate the customers, jobs, products, revenue, costs, and volumes connected to those results. This provides a more practical starting point for margin analysis and corrective action.
Understand Customer Contribution More Clearly
High customer volume does not always translate into strong customer profitability.
Some customers may provide regular consolidation activity but require additional operational effort through urgent handling, extra documentation, repeated follow-ups, special billing arrangements, or added transport and warehouse support.
The customer-wise gross profit view helps your team compare which accounts contribute positively and which may be weakening overall margins.
The BI dashboard also highlights the top-performing and lowest-performing customers based on gross profit. This gives commercial and finance teams a clearer understanding of each customer’s financial contribution.
Instead of reviewing customers only by shipment count or consolidation volume, managers can assess whether each account is creating sustainable value for the business. These insights can support customer performance reviews, pricing discussions, service cost recovery, contract evaluations, and account management decisions.
Review Job and Product Performance
A consolidation may include multiple job and product categories, each of which may perform differently.
The BI dashboard analyzes gross profit at both the job and product levels, assisting managers in determining where value is generated during the consolidation process.
Freight point-to-point, customs clearance, cross-trade, origin services, destination services, and other operational categories may all be included in job-level analysis.
Product-level analysis can include FCL, LCL, LTL, FTL, OBC, LSE, 3PL, and other product groups.
By comparing these categories, managers can determine which services contribute the most to consolidation profitability.
For example, the primary freight movement may have a healthy margin while the supporting service underperforms. Similarly, a product category may have a high volume but still require a pricing, cost, or process review.
These insights help operations and finance teams understand where value is being created and where performance improvements may be necessary.
Move from Summary Results to Individual Consolidations
A summary view of WiseBI’s CargoWise Consolidation Insights Dashboard will reveal that a problem exists, but managers must still identify the specific consolidation or job that resulted in the issue.
The consolidation data view provides detailed information such as:
- Consolidation number
- Job number
- Product level
- Job level
- Volume
- Revenue
- Cost
- Gross profit
This enables users to navigate from the overall dashboard result to a specific consolidation and its associated job records.
For example, if a customer has a low gross profit, the team can examine the associated consolidations to determine whether the problem is caused by low revenue, high costs, incorrect cost allocation, missing charges, or a specific job or product category.
This drill-down capability makes the dashboard useful for more than just performance reporting; it can also be used for detailed investigation and problem-solving.
Monitor Consolidation Processing Time
The BI dashboard also measures the average consolidation processing time in days and hours.
This is significant because processing time influences both operational efficiency and profitability.
A consolidation that is left open for too long may necessitate additional customer follow-up, documentation work, warehouse occupancy, transportation coordination, cost verification, and administrative effort.
Managers can identify records that are taking longer than expected by looking at the average consolidation time.
They can then look into whether the delays are due to missing documents, customs procedures, customer instructions, carrier issues, late cost posting, or internal workflow gaps.
This enables the company to look beyond financial performance and determine the operational effort required to manage each consolidation.
How does the Dashboard Help Different Teams?
WiseBI’s CargoWise Consolidation Insights Dashboard helps various teams in the freight forwarding industry.
Operations teams can review processing times, job categories, product performance, and individual consolidation details.
Finance teams can compare revenue, costs, gross profit, and low- or negative-margin consolidations.
Commercial teams can assess customer profitability and identify accounts that may require pricing, contract, or service reviews.
Leadership teams can evaluate overall performance by year, company, trade lane, consolidation number, and selected metric.
Instead of working from separate reports, all teams can review the same dashboard data during customer reviews, operational meetings, financial discussions, and management decisions.
This shared consolidation visibility demonstrates how CargoWise BI dashboards solve reporting gaps and enables teams to investigate performance more effectively.
Conclusion
Consolidation performance involves more than measuring cargo volume or shipment activity. Freight forwarders also need to understand how customers, jobs, products, costs, revenue, and processing time affect the final result.
A CargoWise Consolidation Insights Dashboard brings these details together in one reporting view, helping teams identify profitable consolidations, review weak-margin activity, and investigate the factors behind each result.
With clearer operational and financial visibility, operations, finance, commercial, and leadership teams can make better-informed pricing, service, and performance decisions.
Schedule a free demo to see how WiseBI can help your team turn CargoWise consolidation data into clearer insights and more confident business decisions.