Here’s something most logistics leaders already know but don’t often say out loud: CargoWise holds a goldmine of valuable data, yet many organizations are only scratching the surface of what it can reveal.
Every shipment, job, invoice, customer transaction, cost, and operational update adds another piece to the story of the business. Together, this data can reveal which customers are driving profit, where shipment volumes are changing, which trade lanes are performing well, how branches compare, and where rising costs may be putting pressure on margins.
The challenge begins when teams need to connect those pieces. A simple management question can quickly lead to multiple reports, data exports, spreadsheet filters, and manual calculations. The information is available, but turning it into a clear and timely business view can take more effort than it should.
The real issue is not having enough data. It is being able to see what that data is telling you.
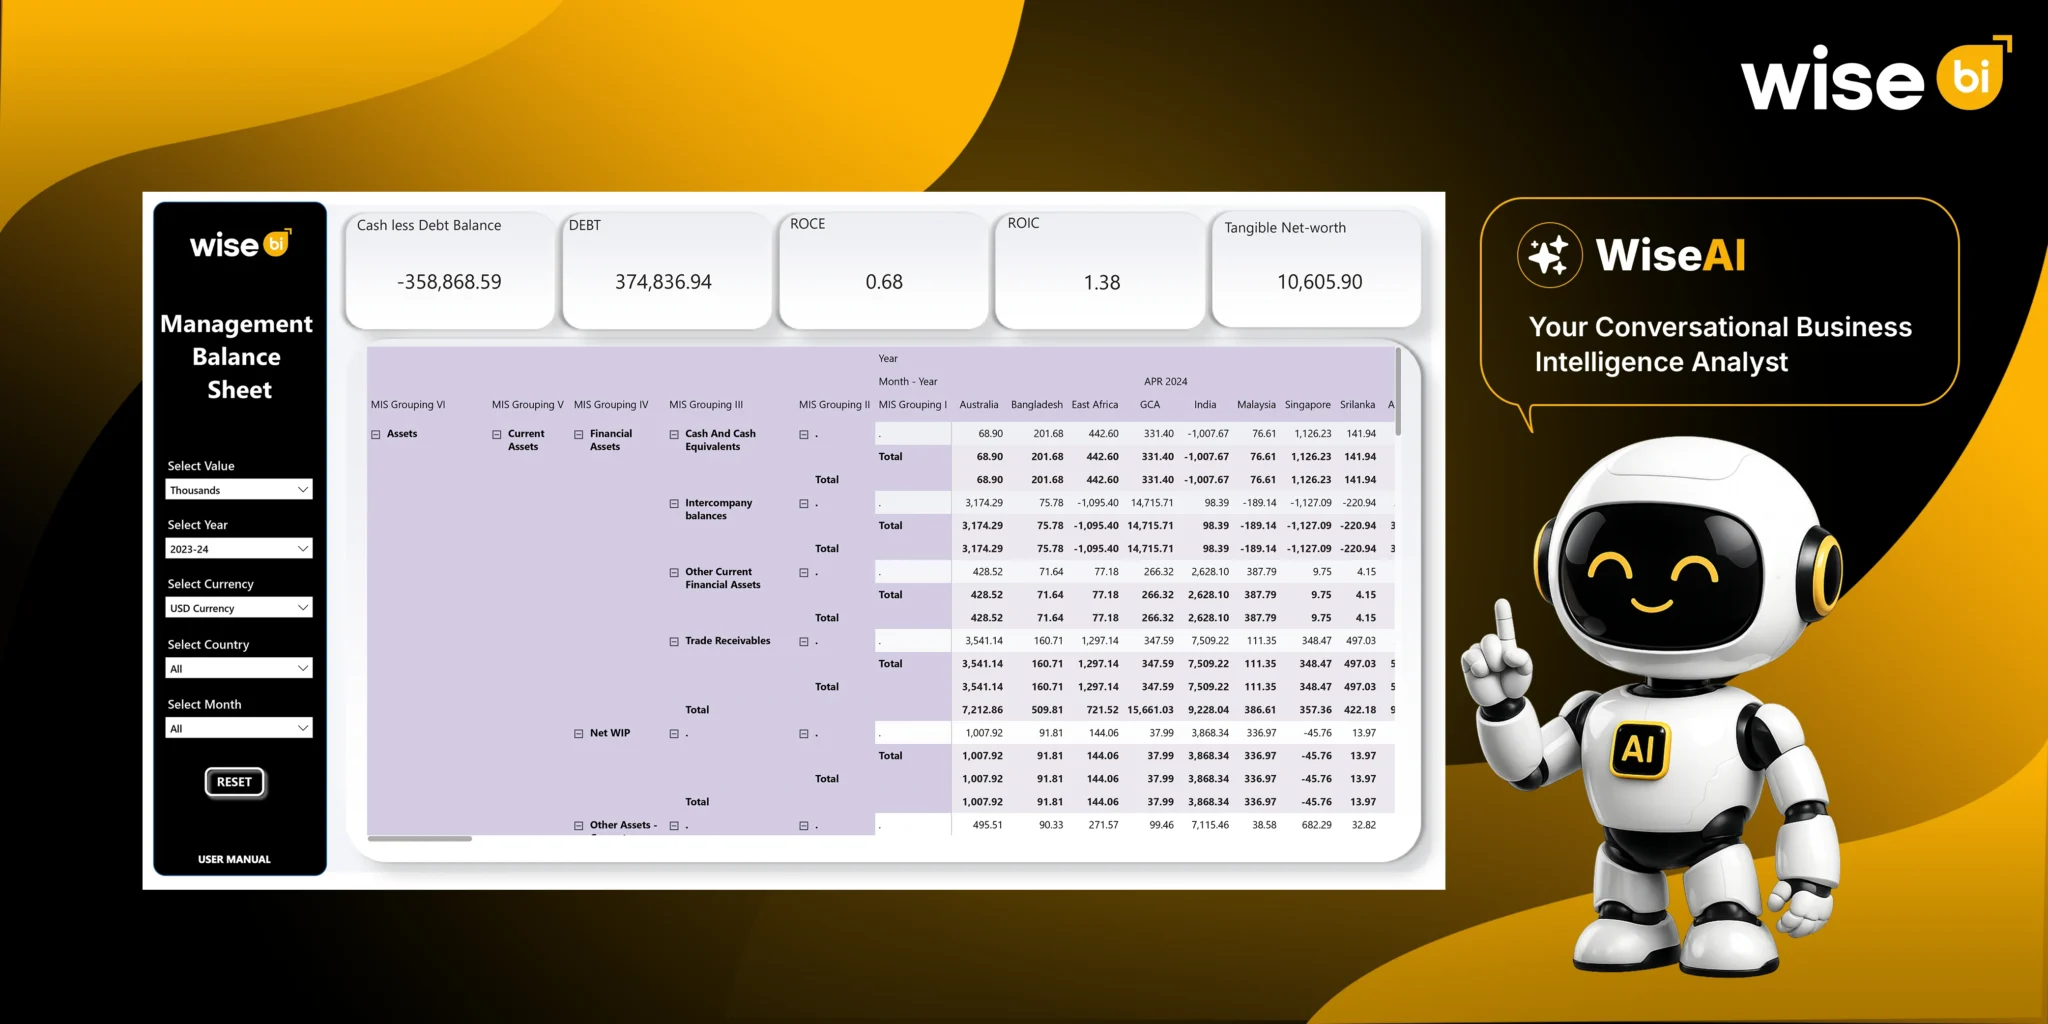
That is where CargoWise + Power BI can help. Power BI dashboards can bring operational, customer, financial, and performance data into connected visual views, helping freight forwarders explore their CargoWise data more easily and turn it into clearer insights for business decisions.
Why is Clear Data Visibility Critical for Logistics Operations?
Most performance issues in freight operations do not appear overnight. They develop gradually: a shipment remains delayed longer than expected, a regular customer starts moving less freight, operating costs begin to rise, or a branch that once delivered strong margins starts becoming less profitable.
When these changes appear only in weekly or monthly reports, teams may already be reacting late. Manual spreadsheets and disconnected reporting can make this harder by leaving finance, operations, sales, and customer service working from different versions of business data.
Operational blind spots can lead to missed opportunities, decisions based on outdated information, delayed responses to issues, and hours spent reconciling data across departments that should be working from the same numbers.
Disconnected data is one of the common CargoWise reporting challenges logistics teams face. When finance, operations, sales, and customer service rely on separate reports, teams can end up working with different views of business performance. Meetings that should focus on what is changing and what action to take may instead be spent figuring out which numbers are accurate.
The answer is not another spreadsheet or another static report. Logistics teams need reliable, up-to-date data visibility presented clearly so they can see what is happening, understand why it matters, and make decisions with greater confidence.
How does Power BI Make CargoWise Data Easier to Visualize?
Power BI can integrate with CargoWise data through methods such as direct database queries, ODBC connections, or structured data exports. Once the data is connected, operational and financial records can be organized into interactive dashboards for deeper business analysis.
Instead of reviewing shipment records, job information, billing entries, customer data, revenue, costs, and AR/AP separately, Power BI can bring relevant information together into connected analytical views.
The flexibility of CargoWise data visualization with Power BI allows teams to:
- Filter performance by customer, branch, trade lane, transport mode, product, origin, destination, or reporting period
- Connect shipment and operational activity with revenue, costs, gross profit, and margins
- Drill down from high-level KPIs into customer, job, branch, or operational details
- Compare performance across different periods and identify important trends
- Give operations, finance, commercial, and management teams relevant views of the same business data
- Reduce dependence on manually prepared spreadsheets and recurring reports
This goes beyond simply turning CargoWise data into charts. Power BI gives logistics teams an interactive way to explore connected business data, understand what is driving performance, and turn detailed CargoWise records into clearer insights for faster, more informed decisions.
Key Dashboards Every Logistics Team Should Track
There is no single dashboard that can answer every logistics business question. Shipment activity, customer performance, finance, profitability, operations, and workforce productivity all require different analytical views.
For CargoWise users, the following dashboard groups can provide a strong foundation for broader business visibility.
Shipment & Volume Analysis Dashboards
Shipment activity is an important indicator of operational demand, but shipment count alone does not provide enough context to evaluate performance.
Shipment & Volume Analysis Dashboards can bring together shipment count, freight volume, revenue, cost, gross profit, customers, countries, products, jobs, and transport modes.
They can help logistics teams understand how shipment activity changes over time, whether higher volumes are producing stronger financial results, how FCL, LCL, and air freight volumes are changing, which customers contribute significant freight activity, and where profitable or loss-making shipments are concentrated.
For operations and management teams, this provides a more meaningful view than monitoring shipment totals alone.
Revenue, Cost & Sales Dashboards
A logistics company can increase revenue without necessarily improving profitability. That is why revenue needs to be viewed alongside costs, gross profit, margins, and sales performance.
Revenue, cost & sales dashboards can help teams monitor:
- Revenue trends
- Operational costs
- Gross profit and gross profit percentage
- Sales performance
- Customer contribution
- Branch performance
- Product and service performance
Connecting revenue and costs provides a clearer picture of whether business growth is translating into healthy financial performance. It can also help commercial and finance teams identify areas where revenue remains strong, but rising costs or weaker margins require closer attention.
Customer Analysis Dashboards
Customer revenue alone does not tell freight forwarders which relationships create the strongest business value.
Customer Analysis Dashboards connect customer activity with revenue, costs, gross profit, job count, freight activity, retention, and long-term contribution.
They can help teams understand which customers contribute strong gross profit, identify high-revenue accounts with weaker margins, monitor changes in customer activity, evaluate how newly acquired customers are developing, recognize potential attrition, and understand long-term customer value.
This gives commercial, finance, and account-management teams a stronger basis for customer retention, account prioritization, pricing reviews, and account-growth planning.
Financial Operations Dashboards
Freight forwarding finance is closely connected to daily operational activity. Revenue may be generated across hundreds or thousands of jobs while supplier costs, receivables, payables, and profitability continue to change.
Financial Operations Dashboards can help teams monitor revenue and costs, gross profit and margins, accounts receivable, accounts payable, customer financial performance, job profitability, and branch-level financial performance.
This makes it easier for finance and management teams to understand how operational activity connects with financial outcomes rather than analyzing the two areas separately.
KPI & Performance Dashboards
Different teams may track dozens of individual measures, but management needs a clear way to understand whether overall performance is moving in the right direction.
KPI & Performance Dashboards bring important operational and financial indicators into a focused management view. These may include shipment activity, revenue, costs, profitability, customer performance, branch results, and other business targets.
Teams can compare current performance with previous periods, targets, branches, customers, products, or other relevant business dimensions. When a KPI changes, users can investigate the underlying data rather than stopping at the headline number.
Operations & Logistics Dashboards
Daily freight operations involve much more than shipment counts. Operations teams may need visibility across jobs, freight movement, warehouses, transportation, customs activities, consolidations, and other operational processes.
Operations & Logistics Dashboards can help teams monitor operational activity, analyze workload across branches or teams, review shipment and job performance, track warehouse activity, understand transportation performance, and identify operational trends requiring attention.
For operational leaders, this creates a clearer picture of day-to-day logistics performance without relying on multiple disconnected reports.
Overall Business & User Productivity Dashboards
Logistics leaders also need to look beyond individual shipments, customers, and financial transactions to understand how the organization is performing as a whole.
Overall business & user productivity dashboards can connect operational, financial, workforce, and system-usage information.
Management can monitor overall job and shipment activity, revenue, costs, profitability, branch and team performance, employee workload and output, user activity, and daily transaction volumes.
This gives leadership a broader view of not only what the business is producing, but also how teams and users contribute to those results.
Benefits of Using Power BI Dashboards for Logistics
When logistics teams can access relevant CargoWise data through well-structured Power BI dashboards, the benefits go beyond making reports easier to read.
- Faster, more informed decisions: Access operational and financial information without waiting for manually prepared reports.
- Clearer operational visibility: View shipment activity, volumes, customers, branches, and other logistics measures through connected dashboards.
- Better trend and performance analysis: Compare historical CargoWise data across periods to identify changes in volumes, customers, revenue, costs, and profitability.
- Stronger cost and margin visibility: Analyze revenue alongside costs, gross profit, and margins across jobs, customers, branches, products, or trade lanes.
- More consistent KPI monitoring: Bring important KPIs and targets into focused views to identify areas requiring further investigation.
The real benefits of dashboards go beyond simply having more reports. They give logistics teams a clearer, more connected view of their data so they can better understand business performance.
Conclusion
For logistics businesses using CargoWise, the challenge is not a lack of data. The opportunity lies in turning that data into clear, accessible insights for everyday decisions.
CargoWise Power BI dashboards can help close the gap between data and decision-making by bringing operational, financial, customer, and performance information into connected analytical views.
Ready to unlock more value from your CargoWise data? Schedule a free demo with WiseBI and see how Power BI dashboards can give your logistics business clearer visibility and actionable insights.