


Total Assets
Monitor the overall value of assets across your business.

Curated dashboards plus predictive insights that recommend your next move
Insights, playbooks and product thinking from the Wise BI team.

Gain complete visibility into your assets, liabilities, equity, and shareholder funds from one connected financial view.


The Problem
Balance sheet data is often spread across account reports, spreadsheets, and financial statements. Manual consolidation slows analysis and makes it harder to understand changes in your financial position.

Assets, liabilities, and equity are often reviewed through separate financial reports.

Drilling into individual balances manually slows financial investigation.

Changes in assets and liabilities can be harder to identify across reporting periods.

Comparing financial position across companies, branches, and departments requires additional reporting.
Solution: Connected intelligence for complete financial visibility.
Capability Overview
The Balance Sheet Dashboard connects assets, liabilities, equity, shareholder funds, and account-level balances, helping finance leaders understand financial position, investigate movements, and compare performance across their business.


Understand your overall balance sheet position.
 Monitor total assetsReview total liabilitiesTrack liabilities and equity

Analyze changes in shareholder value.
Monitor total shareholder fundsReview monthly movementsCompare reporting periods

Investigate the balances behind financial totals.
Review account-level balancesAnalyze financial categoriesTrack balance changes

Compare financial performance across your organization.
Analyze department performanceCompare branch contributionFilter by company and periodMetric Index
Monitor assets, liabilities, equity, and shareholder funds from executive summary to account-level detail.
Total Assets
Monitor the overall value of assets across your business.
Total Liabilities
Track financial obligations and liability balances.
Shareholder Funds
Review shareholder funds and monthly movements.
Liabilities & Equity
Understand the overall funding structure of your business.
Account Balances
Drill into financial accounts and balance changes.
Monthly Financial Position
Compare assets, liabilities, and shareholder funds over time.
Who Benefits from this Dashboard?

Understand your overall financial position from one executive view.

Monitor assets, liabilities, equity, and shareholder funds efficiently.

Investigate account balances and financial movements in greater detail.

Understand contributions to shareholder funds across the organization.
The Balance Sheet Dashboard connects financial position, account balances, and shareholder funds in one executive view, helping leadership understand financial changes and make more informed decisions.
Key Outcomes:
 Monitor assets, liabilities, and equity from one view.Track shareholder fund movements across reporting periods.Compare monthly asset and liability trends.Investigate detailed account-level balance changes.Compare shareholder funds across departments.Review branch-level shareholder fund contribution.Use WiseAI to investigate financial movements and balance sheet trends faster.

"Each insight helps finance leaders understand the company's financial position at a glance."
Combines assets, liabilities, equity, and shareholder funds in one view.Pre-mapped with CargoWise financial data for faster reporting.Provides account-level visibility behind financial totals.Tracks monthly asset and liability movements.Compares shareholder funds across departments and branches.Supports analysis by financial year, month, and company.WiseAI enables natural-language balance sheet analysis.Blogs, newsletters and case studies on CargoWise Balance Sheet Dashboard for Cash Control.
 Blog
Blog
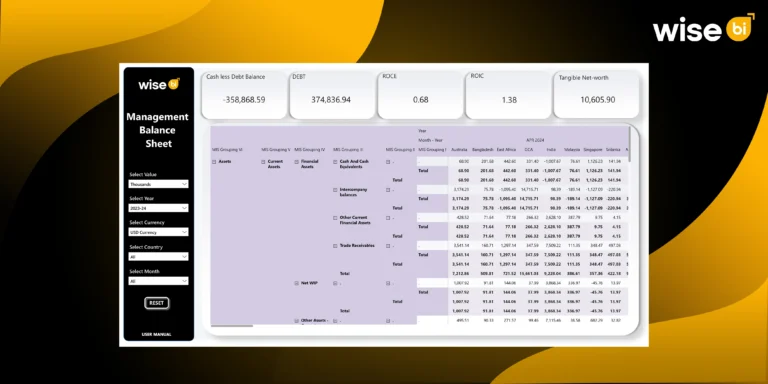
Monitoring your company’s financial health can be challenging when assets, liabilities, receivables, payables, debt, and capital performance are spread across multiple reports and systems.…
 Blog
Blog
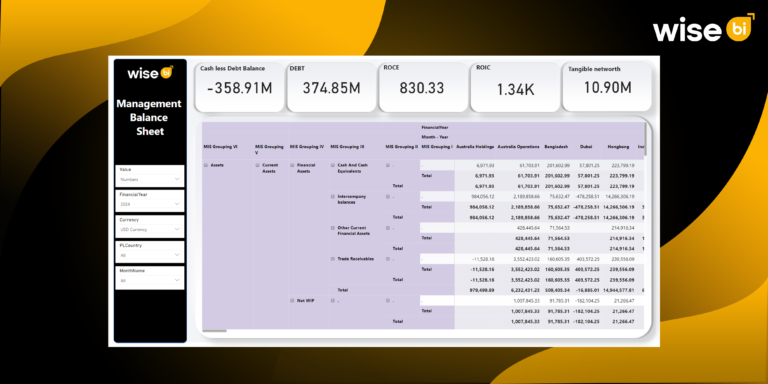
Managing a company’s finances requires more than simply recording numbers in a ledger. Traditional balance sheets reflect assets, liabilities, and equity at a specific…
 Blog
Blog
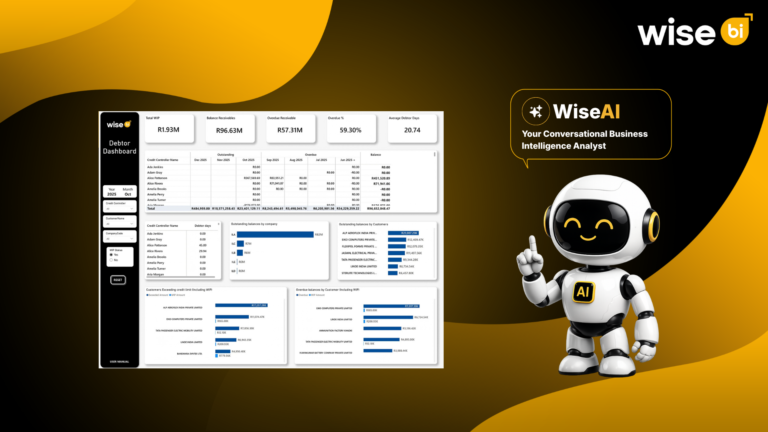
Revenue is recorded when the invoice is raised, but cash flow improves only when the customer pays. A completed freight job does not mean…
Track your assets, liabilities, equity, and shareholder funds in one view, while WiseAI helps you investigate financial movements and uncover performance trends faster than manual analysis.
Yes. Review account-level balances and changes to understand what contributes to your overall financial position.
Use department-wise and branch-wise views to identify how different areas of your business contribute to shareholder funds.
Yes. Interactive filters let you analyze balance sheet performance by financial year, month, and company.
Yes. WiseBI connects assets, liabilities, equity, shareholder funds, account balances, and financial trends to help logistics leaders understand their financial position faster.