


Monitoring your company’s financial health can be challenging when assets, liabilities, receivables, payables, debt, and capital performance are spread across multiple reports and systems.
A management balance sheet dashboard brings your critical financial information into an interactive view, helping you understand your logistics financial position, explore performance across countries and periods, and make more informed decisions.
So, how can you use a real-time management balance sheet dashboard to gain better financial visibility?
Common Financial Health Monitoring Challenges in Logistics
As your logistics operations grow, managing financial activities across customers, suppliers, branches, and countries becomes increasingly complex.
Fragmented data across ERP systems, accounting platforms, spreadsheets, and logistics reports can make financial analysis time-consuming. Your finance team may struggle to gain consistent visibility into receivables, payables, cash, WIP, intercompany balances, and borrowings across the business.
The real challenge is turning complex financial data into clear, actionable insights that support better management decisions.
What is a Management Balance Sheet Dashboard, and Why do You Need it?
A Management Balance Sheet Dashboard is a business intelligence solution that transforms your balance sheet data into an interactive environment for financial analysis.
Instead of reviewing financial information through separate reports and spreadsheets, you can monitor key financial health metrics and explore detailed assets and liabilities from a centralized dashboard.
For your logistics business, this creates a clearer connection between complex financial information and management decision-making.
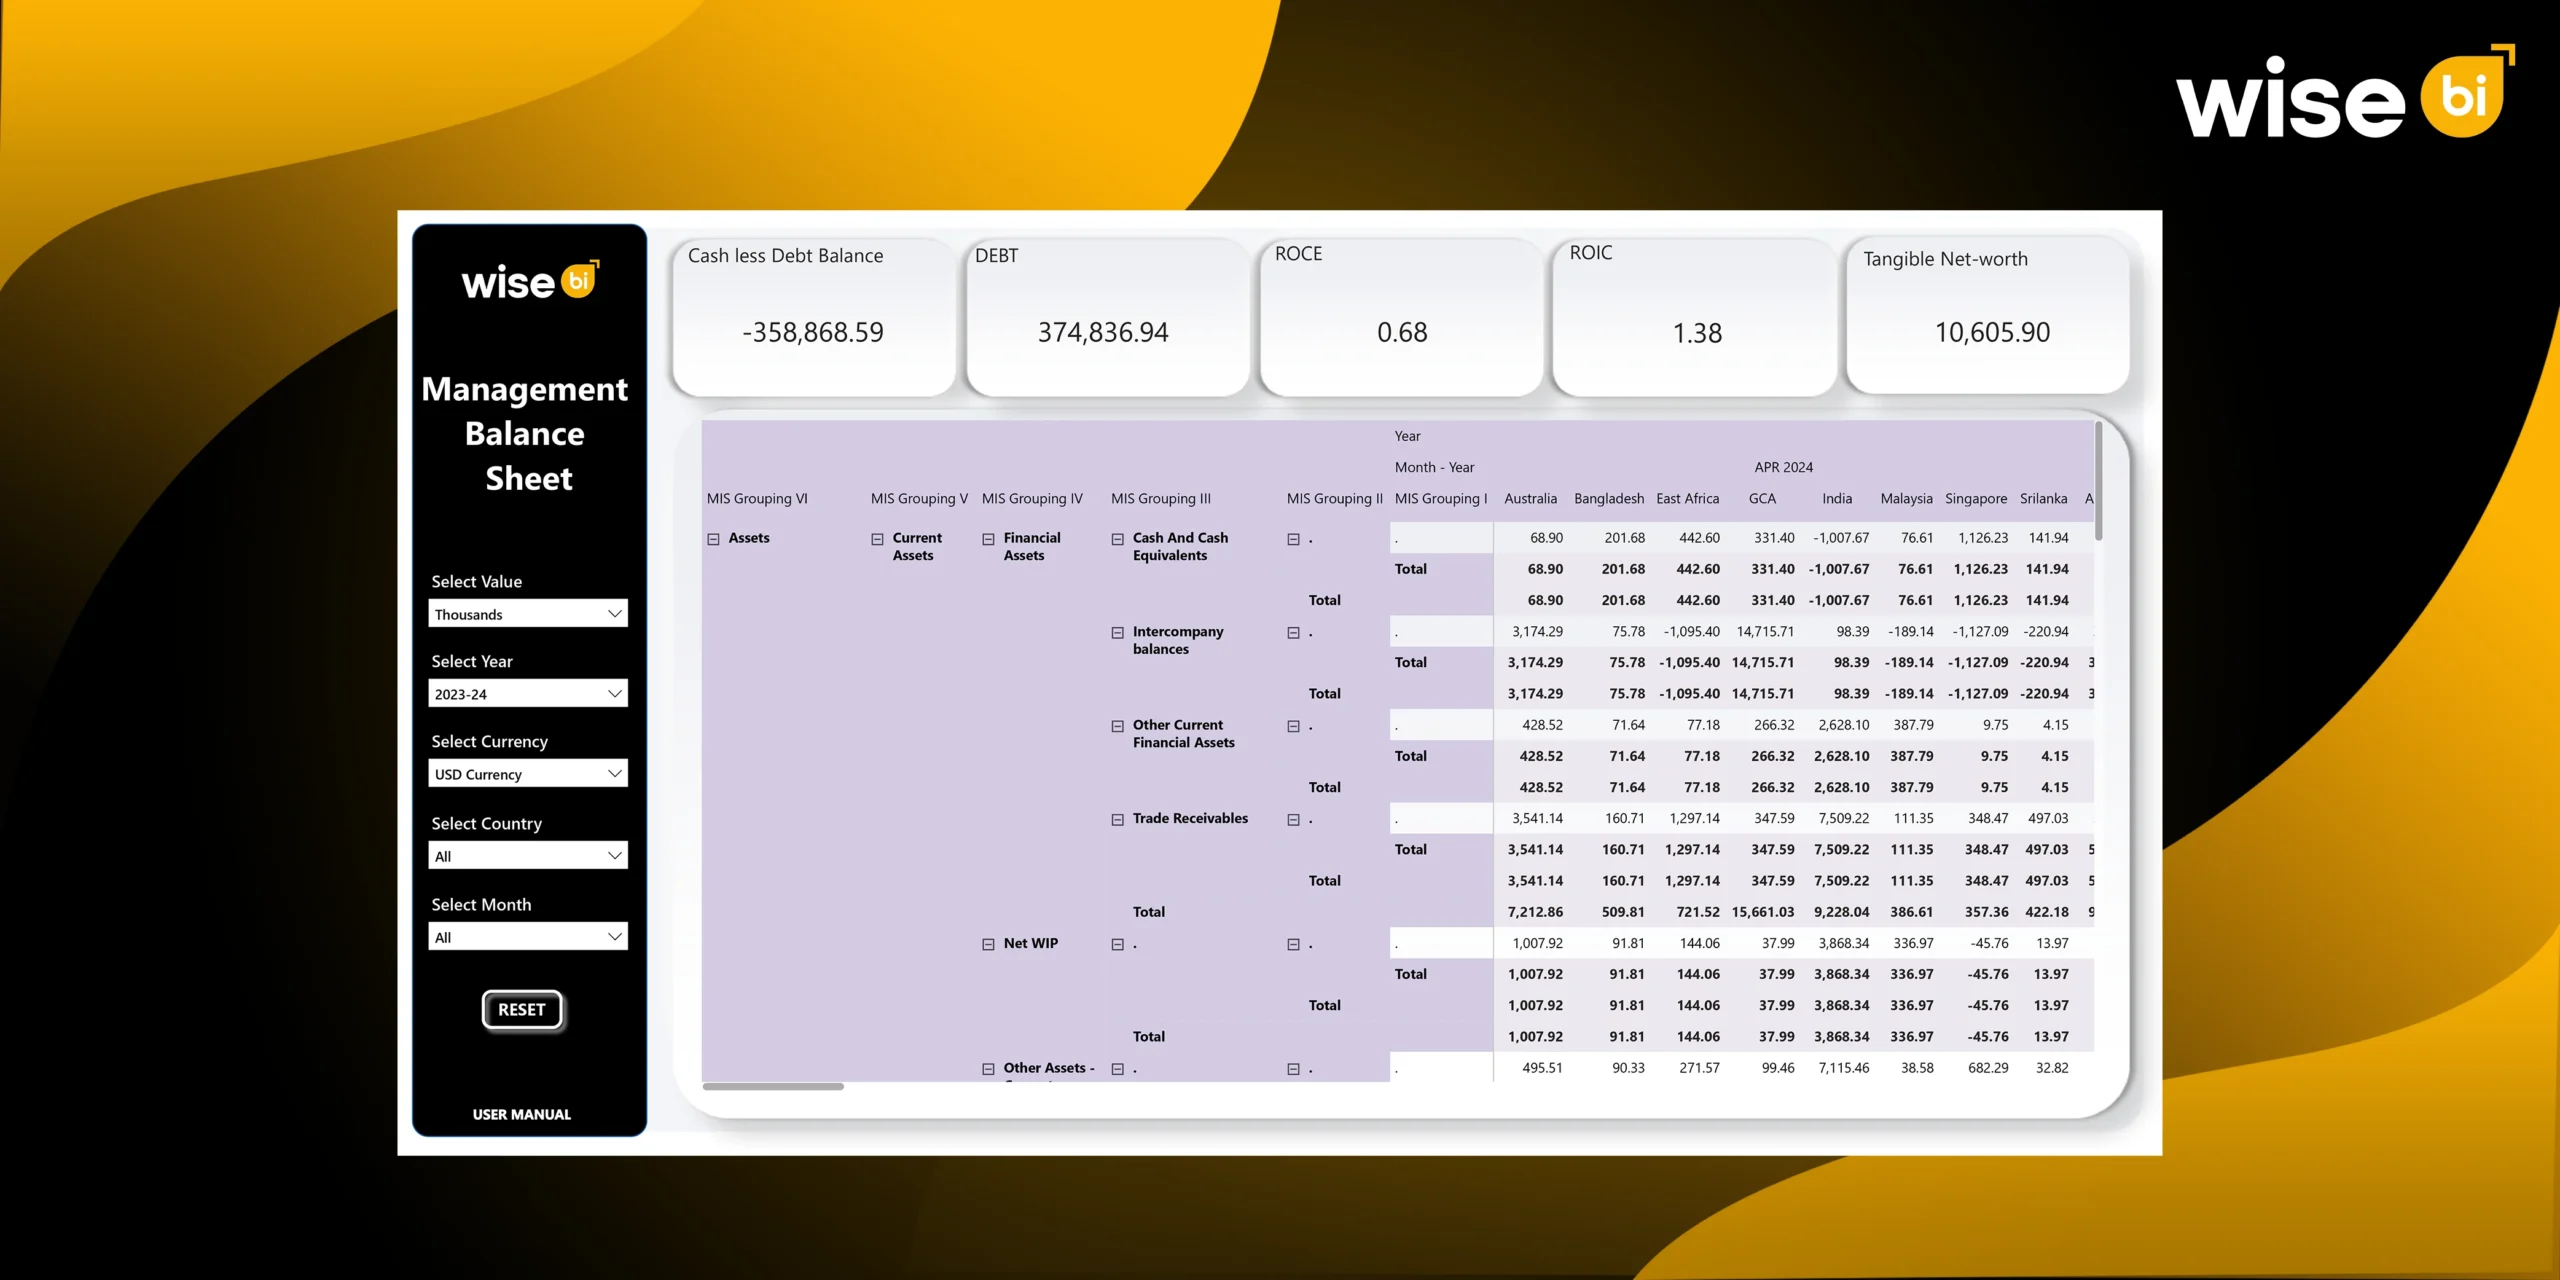
The BI dashboard provides visibility into cash-less debt balance, debt, ROCE, ROIC, and tangible net worth. You can also analyze detailed assets and liabilities using filters for year, month, country, currency, and value scale.
Most importantly, it allows you to transition from spreadsheets to BI dashboards and gain a better understanding of the factors influencing your logistics business’s performance.
Key Financial Health Metrics You Can Monitor with a Management Balance Sheet Dashboard
Understanding your logistics business’s financial health requires a clear view of several key areas, from liquidity and debt to capital performance and financial strength. A management balance sheet dashboard brings these critical metrics together, giving you a more complete view of your financial position.
Cash Less Debt Balance: Understand Your Net Cash Position
Cash Less Debt Balance helps you compare your available cash against your debt obligations.
This provides you with a high-level perspective on the relationship between cash and borrowings. If the balance changes significantly, you can investigate the underlying cash or debt categories for deeper analysis.
Total Debt: Monitor Your Borrowing Position
Monitoring debt is essential for understanding your company’s financial obligations and capital structure.
The dashboard provides a high-level debt metric alongside more detailed visibility into financial liabilities and borrowings.
Instead of relying only on a single debt figure, you can explore relevant liability categories to gain a clearer understanding of your company’s borrowing position.
ROCE: Evaluate How Efficiently You Use Capital
Return on Capital Employed (ROCE) helps you evaluate how effectively your business generates operating profit from the capital employed.
If your logistics company invests significantly in branches, infrastructure, technology, and operational resources, monitoring capital efficiency can provide valuable management insights.
Tracking ROCE alongside other financial metrics gives you a broader perspective on business performance.
ROIC: Understand Your Returns on Invested Capital
Return on Invested Capital (ROIC) provides insight into how efficiently your company generates returns from invested capital.
Monitoring ROIC can help you evaluate capital performance and support broader financial analysis.
Rather than reviewing capital efficiency separately from other financial information, the dashboard allows you to view ROIC alongside debt, net cash position, and tangible net worth.
Tangible Net Worth: Assess Your Financial Strength
Tangible net worth provides another perspective on your company’s financial position by focusing on tangible assets relative to liabilities.
Tracking this metric alongside assets, debt, and other financial indicators can help you gain a more comprehensive understanding of your company’s financial health.
Gain Deeper Visibility into Your Assets
On the asset side, you can analyze cash and cash equivalents, trade receivables, intercompany balances, other current financial assets, net WIP, and other current assets.
This detailed view helps you understand how financial resources are distributed across your organization.
For example, analyzing trade receivables gives you visibility into amounts owed by customers, while cash and cash equivalents provide insight into available liquid resources.
Intercompany balance analysis is particularly valuable if your logistics business operates across multiple entities or countries.
Bringing these categories together helps you move beyond the total asset figure and better understand the composition of your financial position.
Understand Your Liabilities and Financial Obligations
You can also gain detailed visibility into your equity and liabilities.
The BI dashboard enables you to explore categories, including non-current borrowings, secured and unsecured borrowings, other non-current financial liabilities, trade payables, WIP accruals, and other current financial liabilities.
This allows you to analyze your long-term and short-term financial obligations more effectively.
By viewing assets and liabilities within the same analytical environment, you gain a more balanced understanding of your organization’s overall financial position.
How do Interactive Filters and Drill-Down Analysis Strengthen Your Financial Visibility?
One major limitation of traditional financial reporting is the difficulty of quickly moving from consolidated information to focused analysis.
Interactive filters make this process easier.
The BI dashboard simplifies financial reporting by allowing you to filter and analyze financial data by year, month, country, currency, and value scale.
You can begin with an overall financial view and then focus on a specific country or reporting period without relying on multiple separate reports.
This drill-down capability helps you investigate the financial categories behind high-level results and identify areas that require further attention.
How does WiseBI’s Management Balance Sheet Dashboard Support Better Financial Decision-Making?
Better financial decisions begin with clearer visibility.
WiseBI’s management balance sheet dashboard gives you a centralized view of your financial health while making detailed information easier to explore.
You can monitor liquidity and debt, evaluate capital efficiency, understand tangible net worth, analyze assets and liabilities, and compare your financial position across countries and reporting periods. You can also reduce your dependence on fragmented spreadsheets and static reports by accessing relevant financial information within an interactive analytical environment.
Conclusion
Monitoring your financial health requires more than reviewing static balance sheet reports.
With centralized financial KPIs, detailed asset and liability analysis, interactive filters, and drill-down capabilities, the BI dashboard can give you clearer visibility into your financial position and support more informed decisions.
Ready to turn your complex financial data into actionable insights? Schedule a free demo with WiseBI today and discover how interactive financial dashboards can help you improve visibility and make faster, data-driven business decisions.