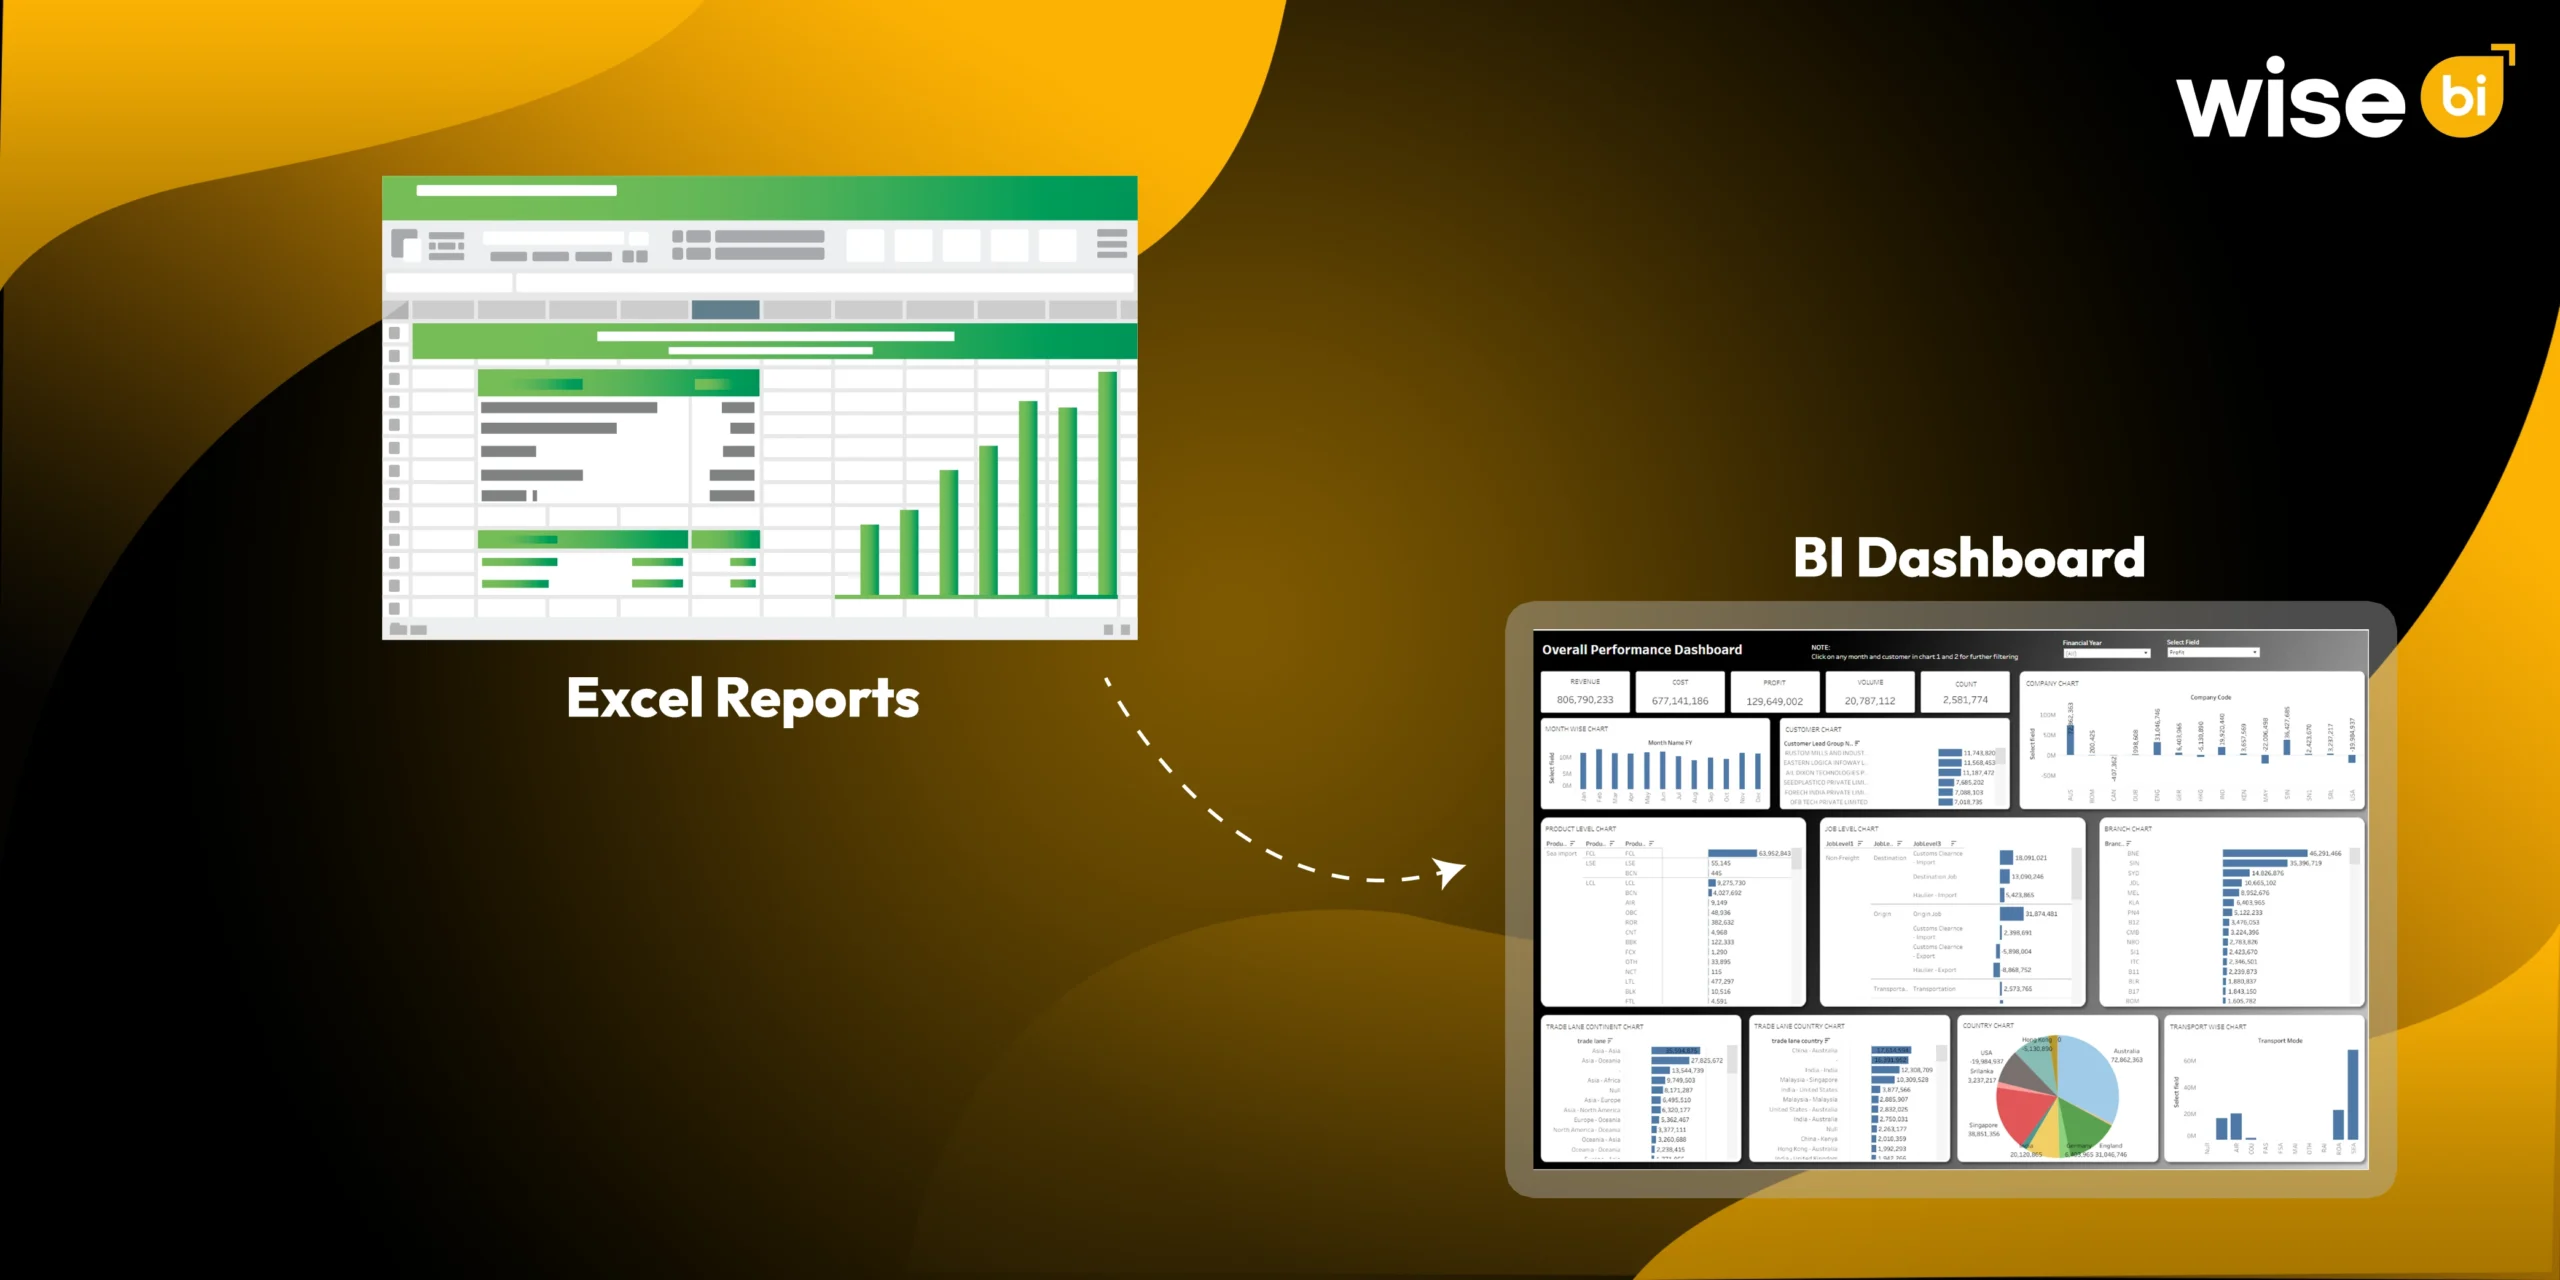
The shift from spreadsheets to BI dashboards transforms logistics operations from reactive, historical reporting to real-time, proactive intelligence.
A spreadsheet can show you what occurred yesterday. A business intelligence dashboard helps you understand what needs to be done today.
For years, logistics teams relied on spreadsheets to keep track of shipments, costs, warehouse activity, customer performance, invoices, transportation updates, and management reports. Spreadsheets have helped many businesses stay organized. They are versatile, familiar, and simple to use.
However, logistics reporting has changed.
Freight forwarders, 3PLs, warehouse operators, transportation companies, and supply chain teams handle more data than ever before. Shipments travel in multiple modes. Customers expect quicker updates. Costs change rapidly. Branches operate in various regions. Finance teams require accurate visibility into revenue, costs, and margins.
When all that data sits in separate spreadsheets, reports, and systems, decision-making slows.
That is why more logistics companies prefer BI dashboards. The goal isn’t just to create better-looking charts. The ultimate goal is to convert disparate logistics data into clear, connected, and decision-ready insights.
Why do Logistics Teams Still Depend on Spreadsheets?
Spreadsheets are not the problem. They continue to play an important role in logistics reporting.
Teams use spreadsheets because they are simple, quick, and familiar. They work well for small datasets, temporary reports, quick calculations, one-time analysis, and basic performance tracking.
For example, a small operations team may use a spreadsheet to track daily shipments. A finance team may use one to compare monthly revenue. A warehouse manager may use one to monitor basic stock movement.
This works for a while.
The problem arises as the company grows and reporting becomes more complex. Suddenly, the same spreadsheet must handle data from multiple branches, customers, products, transportation modes, invoices, warehouses, and financial systems.
At this point, spreadsheets become more difficult to maintain and break.
Where does Spreadsheet Reporting Start to Break Down?
The first sign is usually time.
Your team dedicates several hours to exporting reports, cleaning columns, updating formulas, verifying numbers, and combining files. By the time the report reaches management, the data may be out of date.
This is a major logistical challenge because operations move quickly.
The shipment may be delayed after the report has been exported. A cost may be updated after finance has closed the file. A customer may raise an exception before the dashboard meeting even begins.
Spreadsheet reporting causes a few common issues:
- Data is pulled from too many systems
- Different teams maintain different versions
- Formulas can break without anyone noticing
- Manual copy-and-paste errors affect accuracy
- Reports take too long to prepare
- Teams spend more time checking numbers than acting on insights
Another major issue is inconsistency in reporting. Operations may track shipment volume in one way, whereas finance tracks profitability in another. Sales may be focused on customer revenue, whereas leadership is interested in gross profit and margin trends.
When everyone works from a different file, meetings can devolve into arguments over which number is correct.
That’s not proper reporting. That is known as reporting friction.
What is Changing in Logistics Reporting?
Logistics reporting is moving from static files to connected BI dashboards.
Instead of waiting for weekly or monthly spreadsheets, teams prefer live or frequently updated views of business performance. They want to view shipment trends, cost pressures, delivery delays, warehouse activity, customer performance, revenue, gross profit, and operational exceptions all in one place.
A logistics BI dashboard helps to bring these insights together.
The shift does not entail replacing all spreadsheets. It is important to recognize when critical reporting has outgrown manual files.
Modern logistics teams require reporting, that is:
- Faster
- More accurate
- Easier to compare
- Connected across departments
- Built around consistent KPIs
- Easy to filter and drill down
- Useful for daily and leadership decisions
This is where business intelligence dashboards are becoming increasingly important. They sit between your logistics systems and decision-makers, transforming raw data into business visibility.
How do BI Dashboards Change Logistics Reporting?
A BI dashboard transforms reporting by reducing manual effort and improving how teams understand performance.
Instead of manually combining reports from ERP, TMS, WMS, accounting software, and customer service tools, a BI dashboard can combine key data into a single structured view.
This benefits logistics businesses in several ways.
Centralized Visibility
A logistics business intelligence dashboard provides teams with a centralized view of performance. Operations, finance, sales, warehouse, transportation, and leadership teams can all use common metrics.
This improves alignment because everyone sees the same performance picture.
Faster Reporting
Manual reporting takes time. BI dashboards reduce repetitive work by refreshing data on a set schedule.
That means your team will spend less time preparing reports and more time interpreting the data.
Consistent KPIs
The BI dashboard helps to standardize KPI definitions. Revenue, cost, gross profit, shipment count, on-time delivery, warehouse productivity, and customer performance can all be calculated using established business rules.
This results in a more powerful single source of truth.
Better Performance Monitoring
Charts, KPI cards, filters, and trend views make it easier to see what is improving and what needs to be addressed.
Instead of scrolling through rows of data, users can quickly spot patterns, exceptions, and performance gaps.
Deeper Drill-Down Analysis
A spreadsheet may show that profit has dropped. A BI dashboard allows users to drill down by customer, branch, product, transport mode, route, vendor, or time period to determine why something happened.
That is the true value.
A good BI dashboard does not simply display numbers. It enables your team to ask better questions and find better solutions.
Spreadsheets vs. BI Dashboards
| Reporting Area | Spreadsheets | BI Dashboards |
| Data preparation | Mostly manual | More automated |
| Data sources | Often separate | Connected |
| Refreshing reports | Periodic and manual | Scheduled or near real-time |
| Error risk | Higher due to manual work | Lower with defined logic |
| Collaboration | Multiple file versions | Shared dashboard view |
| KPI consistency | Depends on each file | Based on business rules |
| Analysis | Limited by tabs and formulas | Filters and drill-downs |
| Scalability | Harder as data grows | Better for recurring reporting |
| Decision-making | Often historical | More timely and actionable |
Spreadsheets still work well for quick analysis. But for recurring logistics reporting, BI dashboards are more scalable and reliable.
Does Your Logistics Company Require a BI Dashboard?
If your logistics team is experiencing the same reporting issues month after month, your company may be ready for a BI dashboard.
Here are some clear signs:
- Your team prepares the same reports repeatedly
- Reports require data from multiple systems
- Managers receive different numbers for the same KPI
- Reports are outdated before they are reviewed
- Teams cannot quickly explain why performance has changed
- Leadership lacks a complete business view
- Reporting becomes harder as shipment volume grows
- Finance, operations, and sales work from separate reports
If these issues sound familiar, your reporting system may have outgrown spreadsheets.
The BI dashboard can help you integrate operational and financial data, reduce reporting delays, and boost decision-making confidence.
Why does this Matter for Logistics Leaders?
For logistics executives, reporting is more than just knowing what happened. It is about understanding what requires attention.
If shipment volume increases but profit decreases, leadership must understand why. If warehouse activity is increasing while delays are increasing, operations require visibility. If a customer generates a high revenue but a low margin, sales and finance should investigate the account.
A logistics BI dashboard helps to connect the dots.
It gives leaders better visibility into:
- Shipment Performance
- Revenue and Cost Trends
- Gross Profit and Margin
- Customer contribution.
- Branch Performance
- Warehouse Productivity
- Transportation efficiency
- Vendor and carrier performance
- Service-level trends
This enables businesses to shift from reactive reporting to proactive decision-making.
Conclusion
Spreadsheets will always have a place in logistics. They are useful, flexible, and familiar. But when a logistics business depends on spreadsheets for complex, recurring, company-wide reporting, the process can become slow, inconsistent, and difficult to scale.
BI dashboards change logistics reporting by connecting data, standardizing KPIs, reducing manual preparation, and giving teams a clearer view of business performance. The real shift is not simply from spreadsheets to dashboards. It is from spending time building reports to spending time making better decisions.
Is your logistics team still spending hours combining spreadsheets and checking report versions?
Schedule a free demo with Wise BI and see how a logistics BI dashboard can bring your operational and financial data into one clear, decision-ready view.