Revenue does not tell you which customers are truly valuable
A customer may generate strong revenue and still deliver a weak return.
For freight forwarders, customer value depends on more than sales. Job activity, servicing cost, pricing, operational effort, and gross profit all determine whether an account is contributing sustainably to the business.
A high-volume customer may require frequent documentation, urgent handling, repeated follow-ups, special billing, or additional transport and warehouse support. Another customer may generate fewer jobs but deliver a much healthier margin.
When customer activity and financial results are reviewed separately using CargoWise reports, the differences are hard to see.
Why is Customer Performance Difficult to Evaluate in CargoWise?
Customer performance can vary radically depending on the metric being reviewed.
Operations may focus on job count. Commercial teams may focus on revenue. Finance may focus on gross profit. Leadership may want to know whether customer performance is improving or declining compared with the previous year.
Looking at only one measure can lead to an incorrect conclusion.
A high-revenue account may also incur high costs. A customer with a large number of employees may put significant operational strain on the business without producing a high margin. Another account may be profitable but has a clear year-over-year decline.
When customer activity, revenue, cost, and profitability are evaluated separately, management may overlook significant changes in account performance. This is why CargoWise users require a customer analysis dashboard to link operational activity and financial outcomes.
What is a CargoWise Customer Analysis Dashboard?
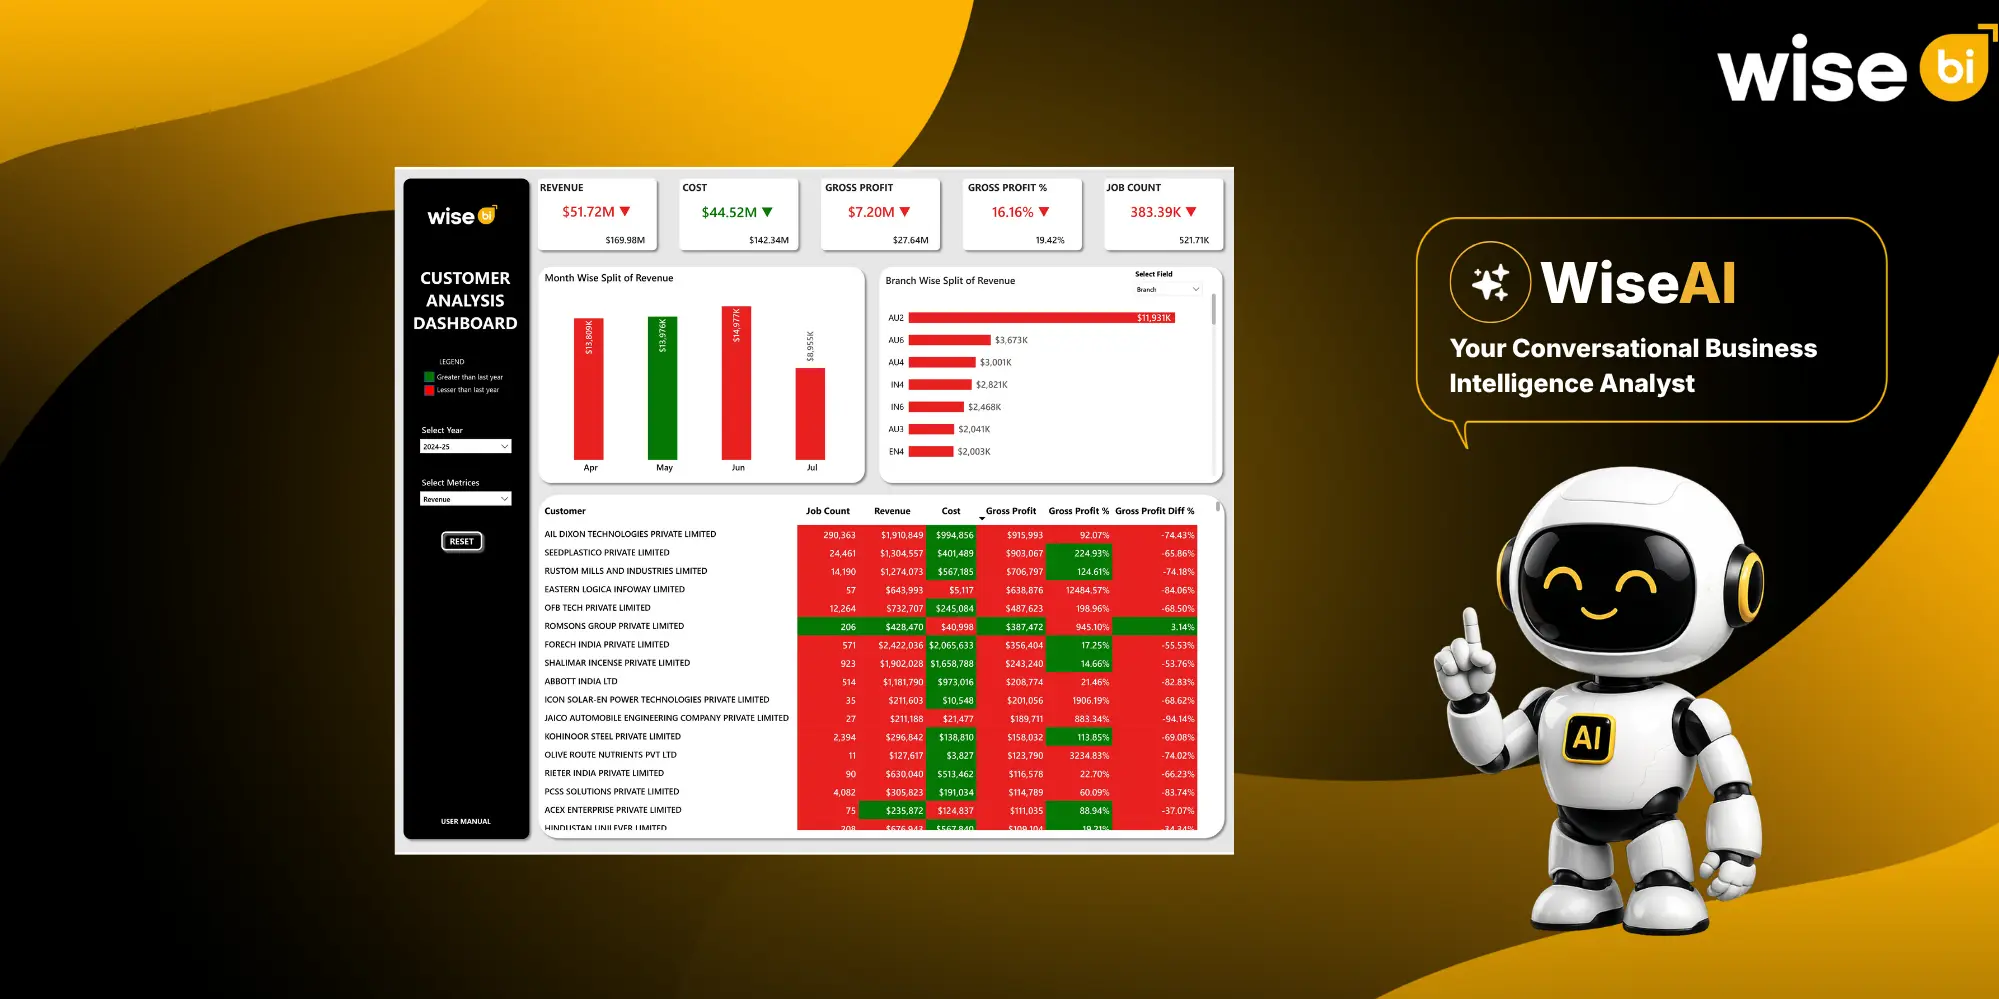
A CargoWise Customer Analysis Dashboard is a business intelligence reporting solution that transforms CargoWise customer and financial data into interactive performance views.
The dashboard brings together:
- Customer job count
- Revenue
- Cost
- Gross profit
- Gross profit percentage
- Gross profit difference percentage
- Month-wise revenue
- Branch-wise revenue
- Current-year and previous-year comparisons
Users can also select the metric and reporting field they want to analyze.
Instead of rebuilding customer reports every month, executives can review customer performance in one BI environment and quickly identify where attention is needed. This shows the benefits of a CargoWise customer analysis dashboard in practice by helping freight forwarders compare customer activity with profitability and make better pricing, account, and commercial decisions.
See Which Customers Create Revenue and Which Create Profit
Revenue tells you how much business a customer generates. It does not tell you how valuable that business is after costs are considered.
The BI dashboard places revenue, cost, gross profit, and gross profit percentage alongside each customer, making it easier to compare activity with profitability. For a deeper breakdown, explore the CargoWise Customer Dashboard KPIs your team can track.
This makes customer revenue and volume analysis more useful because your team can see the return behind the sales figure.
For example, one customer may generate high revenue but incur high transport, handling, or servicing costs. Another may generate lower revenue while producing a stronger gross profit.
That changes the commercial question from:
Which customers generate the most revenue?
to:
Which customers generate the strongest and most sustainable profit?
This information can help with pricing reviews, contract negotiations, account prioritization, and service decisions.
Understand Whether Customer Activity is Commercially Worthwhile
Job count shows how active a customer is, but activity creates operational work.
More jobs can mean more bookings, documentation, billing, communication, exception handling, and coordination across teams.
The dashboard allows you to analyze customer job counts as well as revenue, costs, and gross profit.
This allows management to identify various account profiles:
- High job count with healthy profit
- High job count with weak margin
- Low job count with strong profitability
- High revenue with disproportionate cost
A customer who generates a large workload should also provide enough commercial value to justify their efforts.
This is where freight forwarding customer profitability becomes very important.
Spot Customer Profitability Decline Before it Becomes a Bigger Problem
A customer does not need to be losing money before action is required.
Profitability can gradually decline while revenue remains relatively stable.
The BI dashboard displays the gross profit difference percentage and current-versus-previous-year comparisons, which help managers determine whether CargoWise customer profitability is increasing or decreasing.
If gross profit declines significantly, your team can look into questions like:
- Has customer pricing stayed unchanged while supplier costs increased?
- Are more services being provided without additional charges?
- Has the shipment mix changed?
- Is one branch handling the account less efficiently?
- Has operational effort increased?
Early visibility gives commercial and finance teams more time to respond before the margin deteriorates further.
Follow Customer Revenue Trends Month by Month
Annual revenue can hide important changes during the year.
The dashboard provides a month-wise split of revenue, helping teams see when customer activity rises, falls, or changes direction.
A sudden decline may indicate reduced customer activity. Consistent growth may show that an account is expanding. Irregular movement may reflect seasonality or changing shipment patterns.
Monthly customer revenue trends can help your team understand:
- Whether customer activity is slowing
- Whether growth is consistent
- Whether demand is seasonal
- Whether a pricing change affected volume
- Whether reliance on a few strong months is increasing
These insights support forecasting, retention planning, and account reviews.
Compare Customer Performance Across Branches
For multi-branch freight forwarders, company-wide customer performance can hide local differences.
The dashboard includes a branch-wise split of revenue, helping leadership understand where customer business is being generated.
This branch-wise customer performance view can reveal:
- Which branches generate the most customer revenue
- Where customer performance is weakening
- Whether the same account performs differently across branches
- Whether the business depends too heavily on one location
- Where commercial support may be needed
This gives branch managers and leadership a more precise view than overall totals alone.
Move from Customer Ranking to Customer Action
Customer analysis becomes valuable when it changes what your team does next.
The BI dashboard can help management think about customers in three practical groups.
Grow: Accounts with strong activity, healthy revenue, and sustainable gross profit may offer opportunities for additional services, deeper relationships, or greater commercial focus.
Review: Customers whose gross profit or year-over-year performance is declining may need closer analysis.
Reprice: High-activity accounts with rising costs or weak margins may require revised rates, additional service charges, or different commercial terms.
Analyse Customer Performance Faster with Selectable Metrics
Different managers need different customer views.
The BI dashboard includes selectors for different metrics and reporting fields.
A manager may begin by reviewing revenue and then shift the analysis to another available metric or branch.
This flexibility allows teams to investigate customer performance without building a new report for every question.
Conversational BI for Faster Customer Analysis
Conversational BI can make customer performance analytics faster during commercial and management reviews.
Users can ask questions such as:
- Which customers generated the strongest gross profit?
- Which high-job-count customers have weak margins?
- Which customers declined most compared with last year?
- Which branch generated the most customer revenue?
- Which accounts have rising costs but stable revenue?
The Conversational BI analyst can present results as charts, tables, or summaries, and users can ask follow-up questions.
This allows executives to investigate customer performance more quickly without constantly adjusting filters or reports.
Cut Down on Spreadsheet-Based CargoWise Customer Reporting
Spreadsheet-based customer reporting often requires repeated exports, formula checks, manual comparisons, and multiple versions of the same report.
That takes time and can delay customer reviews.
WiseBI’s CargoWise customer analysis dashboard offers a consistent customer performance dashboard, allowing teams to compare job activity, revenue, cost, gross profit, monthly trends, and branch results without having to rebuild the analysis each month.
This allows management to focus on understanding customer performance rather than preparing reports.
Conclusion
Know which customers deserve more attention
Your largest customer isn’t always the most valuable one. WiseBI’s CargoWise customer analysis dashboard allows freight forwarders to link customer job activity to revenue, cost, gross profit, margin performance, year-over-year change, monthly trends, and branch contribution.
This gives operations, finance, commercial, and leadership teams a clearer understanding of which customers are creating sustainable value, which relationships are weakening, and where pricing or service decisions may be needed. Book a free demo with WiseBI to see how the CargoWise Customer Analysis Dashboard can help your team identify profitable customers, spot declining performance earlier, and make stronger customer decisions.