


Revenue growth looks good on a report. More shipments, larger accounts, and higher sales usually suggest that the business is moving in the right direction.
But here is the more important question: How much of that revenue are you actually keeping as profit?
A logistics company can generate more revenue while its margins quietly shrink. The pressure may come from a particular customer, branch, product, department, service, or even a group of individual jobs. When everything is rolled into one overall revenue figure, those profitability issues can be easy to miss.
That is where margin leakage can go unnoticed.
To see what is really happening, logistics companies need to look beyond top-line revenue and connect revenue, cost, gross profit, and gross profit percentage (GP%) with the operational activity behind those figures.
The revenue and cost dashboard makes that analysis easier. Instead of seeing only the final financial result, management can follow profitability from the overall business down through customers, branches, products, departments, and individual jobs to identify where margins require closer attention.
What is Margin Leakage in Logistics?
Margin leakage occurs when a business retains less profit than expected from the revenue it generates.
In logistics, this can happen in several ways. Costs may rise without a corresponding increase in revenue. A high-volume customer may contribute less profit than expected. A product or department may operate at a weaker margin, while individual jobs may fall below profitability targets or generate losses.
The challenge is that margin leakage is not always obvious.
A company can still report strong revenue while parts of the operation produce weaker financial results. That is why revenue should not be evaluated in isolation. Looking at revenue alongside gross profit and GP% provides a clearer indication of whether commercial activity is translating into profitable business.
Why is Margin Leakage Difficult to Spot in Logistics?
Logistics profitability is influenced by activity across multiple levels of the business.
A company-wide result may look healthy even when one country is underperforming. Strong results from one branch can offset weaker performance elsewhere. A profitable product can compensate for losses in another service, while profitable jobs can hide a smaller group of low- or negative-margin transactions.
This aggregation makes the source of margin pressure difficult to identify.
Traditional reporting may show that GP% has changed. What leaders really need to understand is where it changed, what contributed to the movement, and which areas require investigation.
Answering those questions means moving from shipment consolidated performance into more detailed operational and financial information.
How can Revenue and Cost Dashboards Reveal Margin Leakage in Logistics?
Revenue and cost dashboards create that analytical path. Instead of treating revenue, cost, and profit as isolated financial metrics, they allow management to examine how profitability changes across different areas of the logistics operation.
Spot the Warning Signs in Revenue and Gross Profit Trends
The investigation begins with revenue, gross profit, and GP%.
Monthly trends add context by showing how these measures move over time. Revenue, for example, may continue to grow while gross profit grows more slowly. GP% may also begin trending downward even when overall business activity remains strong.
These patterns do not automatically mean margin leakage is occurring, but they provide a reason to investigate further.
This gives management an early starting point: identify an unusual profitability movement first, then determine what is contributing to it. Pasted markdown
Trace Margin Pressure Across Countries, Branches, and Departments
Once a margin movement becomes visible, management can narrow the analysis.
Country-level performance can show whether the pattern is concentrated in a particular market. Branch performance analysis can reveal differences between locations, while department-level views help identify operational areas that require closer attention.
The goal is not simply to rank countries, branches, or departments. It is to understand where financial performance differs from the wider business trend and determine where deeper analysis should begin. Pasted markdown
See Which Products and Services are Pressuring Margin
The next step is understanding which type of business contributes to the result.
Different logistics products and services can produce very different financial outcomes. WiseBI’s product insights allow teams to examine how areas such as sea import, sea export, air freight, customs clearance, 3PL, and other services contribute to performance.
Freight and non-freight activity can also be examined separately while retaining deeper views across jobs, products, companies, and transport activity.
This helps management look beyond which service generates the most revenue and investigate whether the underlying business is producing the expected profitability. Pasted markdown
Identify Where Profit is Being Made or Lost
Revenue rankings and profitability rankings do not always tell the same story.
A major customer may contribute substantial revenue without being the strongest profit contributor. The same principle applies to branches, products, jobs, and departments.
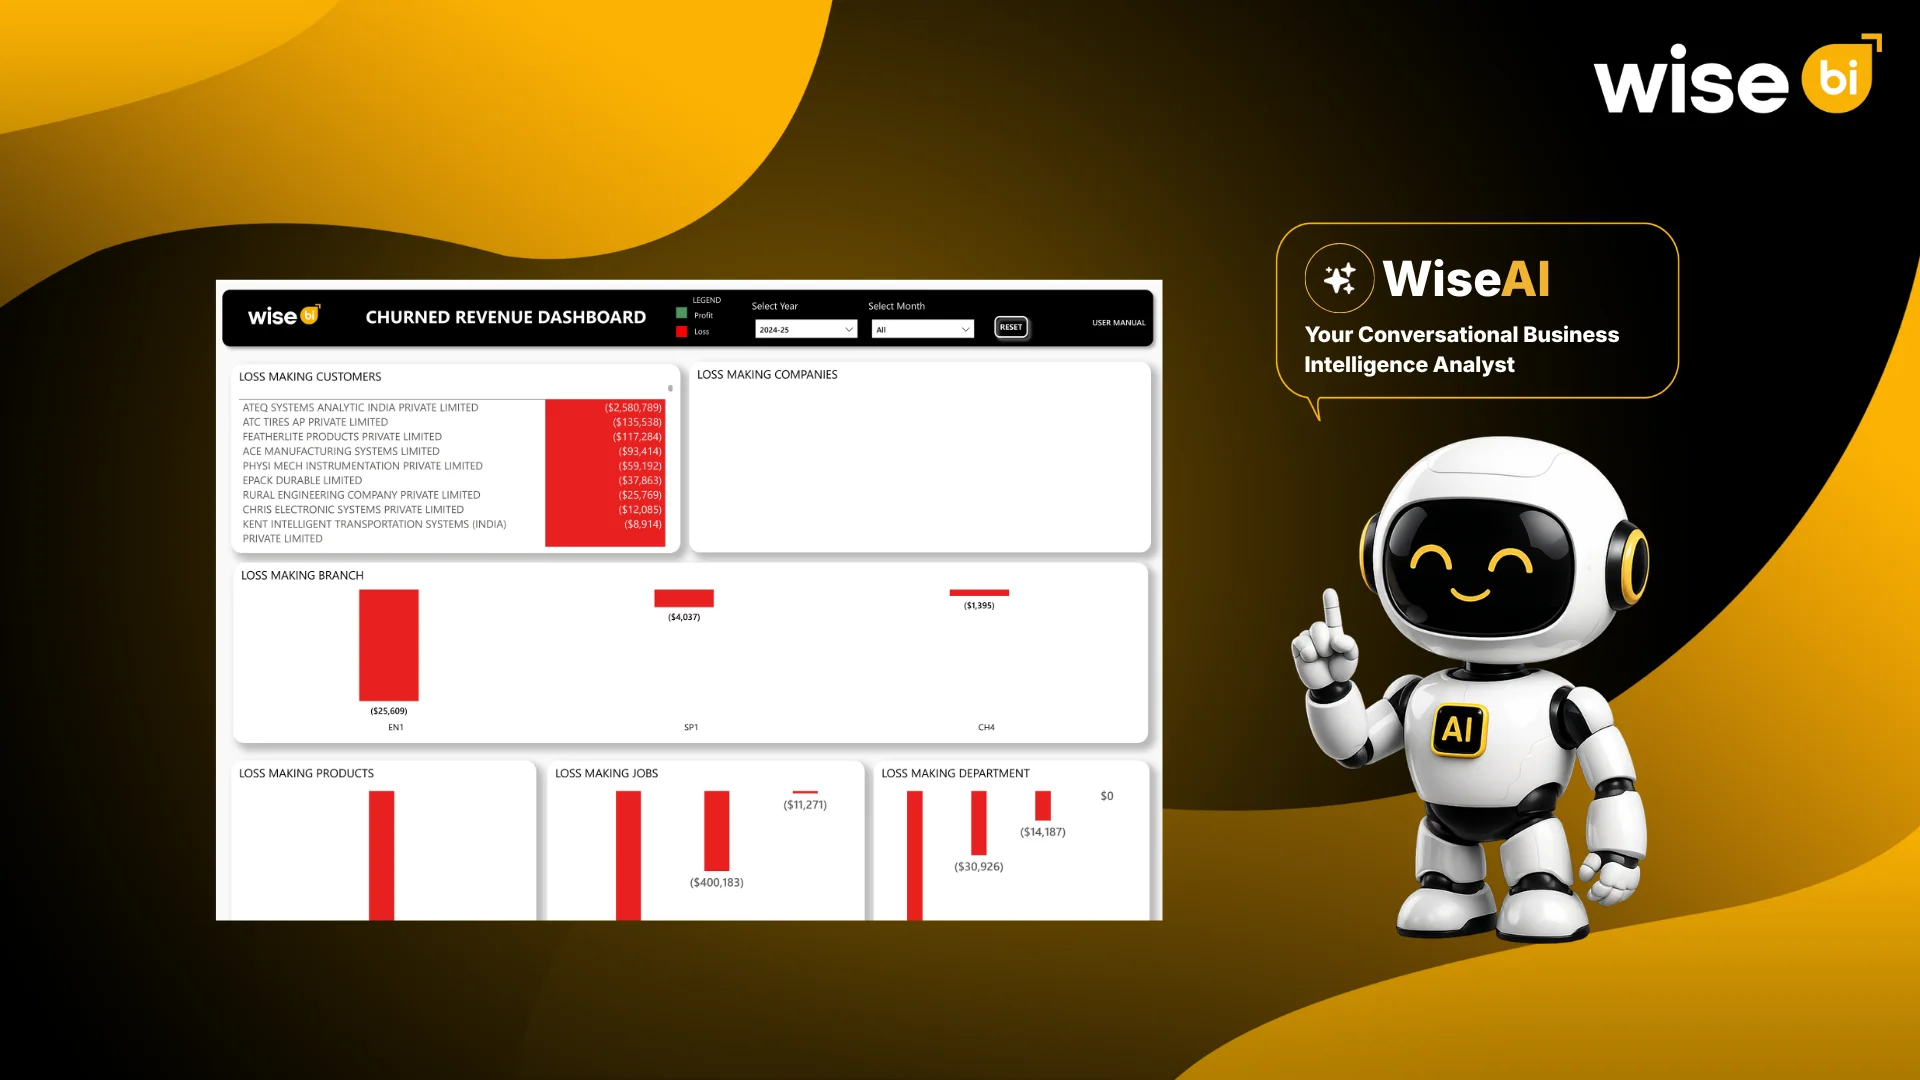
Profitability views help management understand which areas are contributing positively and which are producing losses. This provides a more commercially useful picture than revenue alone.
For example, recurring losses around a customer may warrant closer commercial analysis. Loss-making jobs within a product may require job-level investigation, while an unusual pattern within a branch or department may point teams toward an operational review.
WiseBI’s Profit Insights dashboard identifies where the loss appears. The business can then investigate why it is happening. Pasted markdown
Drill Down from Margin Variance to Individual Jobs
High-level analysis tells management where to look. Job-level analysis brings the investigation closer to the transactions producing the result.
Profit and loss jobs can be examined alongside profitability ranges, benchmarks, customers, branches, departments, job levels, and products.
Teams can then drill into individual jobs and compare revenue, cost, gross profit, and GP%.
This creates a logical investigation path:
Overall profitability → country or branch → department or product → customer → individual job → revenue and cost
Instead of knowing only that profitability has changed, management can reach the transactions that deserve closer attention.
Check Jobs with Missing Financial Activity
Not every profitability risk appears as a visible loss.
Jobs with incomplete financial activity can also require attention. These may include jobs where cost, transaction, consolidation, or related financial activity is missing.
This matters because profitability depends on complete financial information.
If revenue is available but relevant costs have not yet been recorded, the current margin may not represent the eventual financial outcome. Surfacing these jobs gives finance and operations a defined group of records to investigate before relying on the reported margin. Pasted markdown
Turning Margin Insights into Commercial and Operational Action
Finding margin pressure is only the first step. The real value comes from knowing where teams should investigate.
If a customer consistently shows weak profitability, commercial teams can review pricing and cost-to-serve. If a product shows margin pressure, management can examine the jobs contributing to its performance. If one branch or department behaves differently from the rest of the organization, operations can investigate the activities behind the variance.
Individual jobs that fall below expected profitability can be reviewed against their revenue and costs, while jobs with incomplete financial activity can be checked before management relies on their reported margin.
Business intelligence does not replace commercial or operational judgment. It provides a clearer starting point for applying it.
The process becomes:
See the trend → isolate the affected area → identify profit or loss → drill into the jobs → review revenue and cost → investigate the cause → act.
This moves profitability analysis from simply identifying a poor result to understanding where teams should focus their attention. Pasted markdown
Move from Reporting Margin to Managing it
The biggest advantage of connected revenue and cost analysis is that profitability becomes something teams can investigate rather than simply report.
Management can begin with overall business performance and progressively move through countries, branches, departments, products, customers, and individual jobs.
That context makes the final financial result more meaningful.
Instead of reaching the end of the month and asking, “Why did our margin fall?” leadership has a structured way to investigate where the movement originated and which areas require attention.
That is the difference between margin reporting and margin management.
Conclusion
Margin leakage can hide behind strong revenue, growing activity, major customers, and busy operations. It becomes easier to identify when revenue is connected with cost, gross profit, GP%, and the operational activity behind those figures.
Revenue and cost dashboards help logistics companies move from an overall profitability trend to the countries, branches, departments, products, customers, and individual jobs contributing to it. Job-level analysis then provides the revenue and cost detail needed for further investigation.
The goal is not simply to produce another financial report. It is to give management a clearer understanding of where the business makes money, where profitability is under pressure, and where teams need to investigate before smaller margin issues become larger financial problems. Pasted markdown
Book a free demo with Wise BI to see how revenue and cost dashboards can help your logistics team identify margin pressure earlier and make better-informed profitability decisions.