


Freight forwarders using CargoWise generate a large amount of operational and financial data across freight and non-freight activities.
Revenue, costs, gross profit, job types, companies, transport modes, and products are all captured through everyday operations. But when this information sits across different CargoWise reports, understanding the complete business picture can take more time than it should.
Management may know total revenue is increasing but still struggle to answer a few important questions:
- Which business segment is actually driving that growth?
- Which services contribute the strongest gross profit?
- Are higher revenues also improving margins?
- Which products, transport modes, or companies are beginning to underperform?
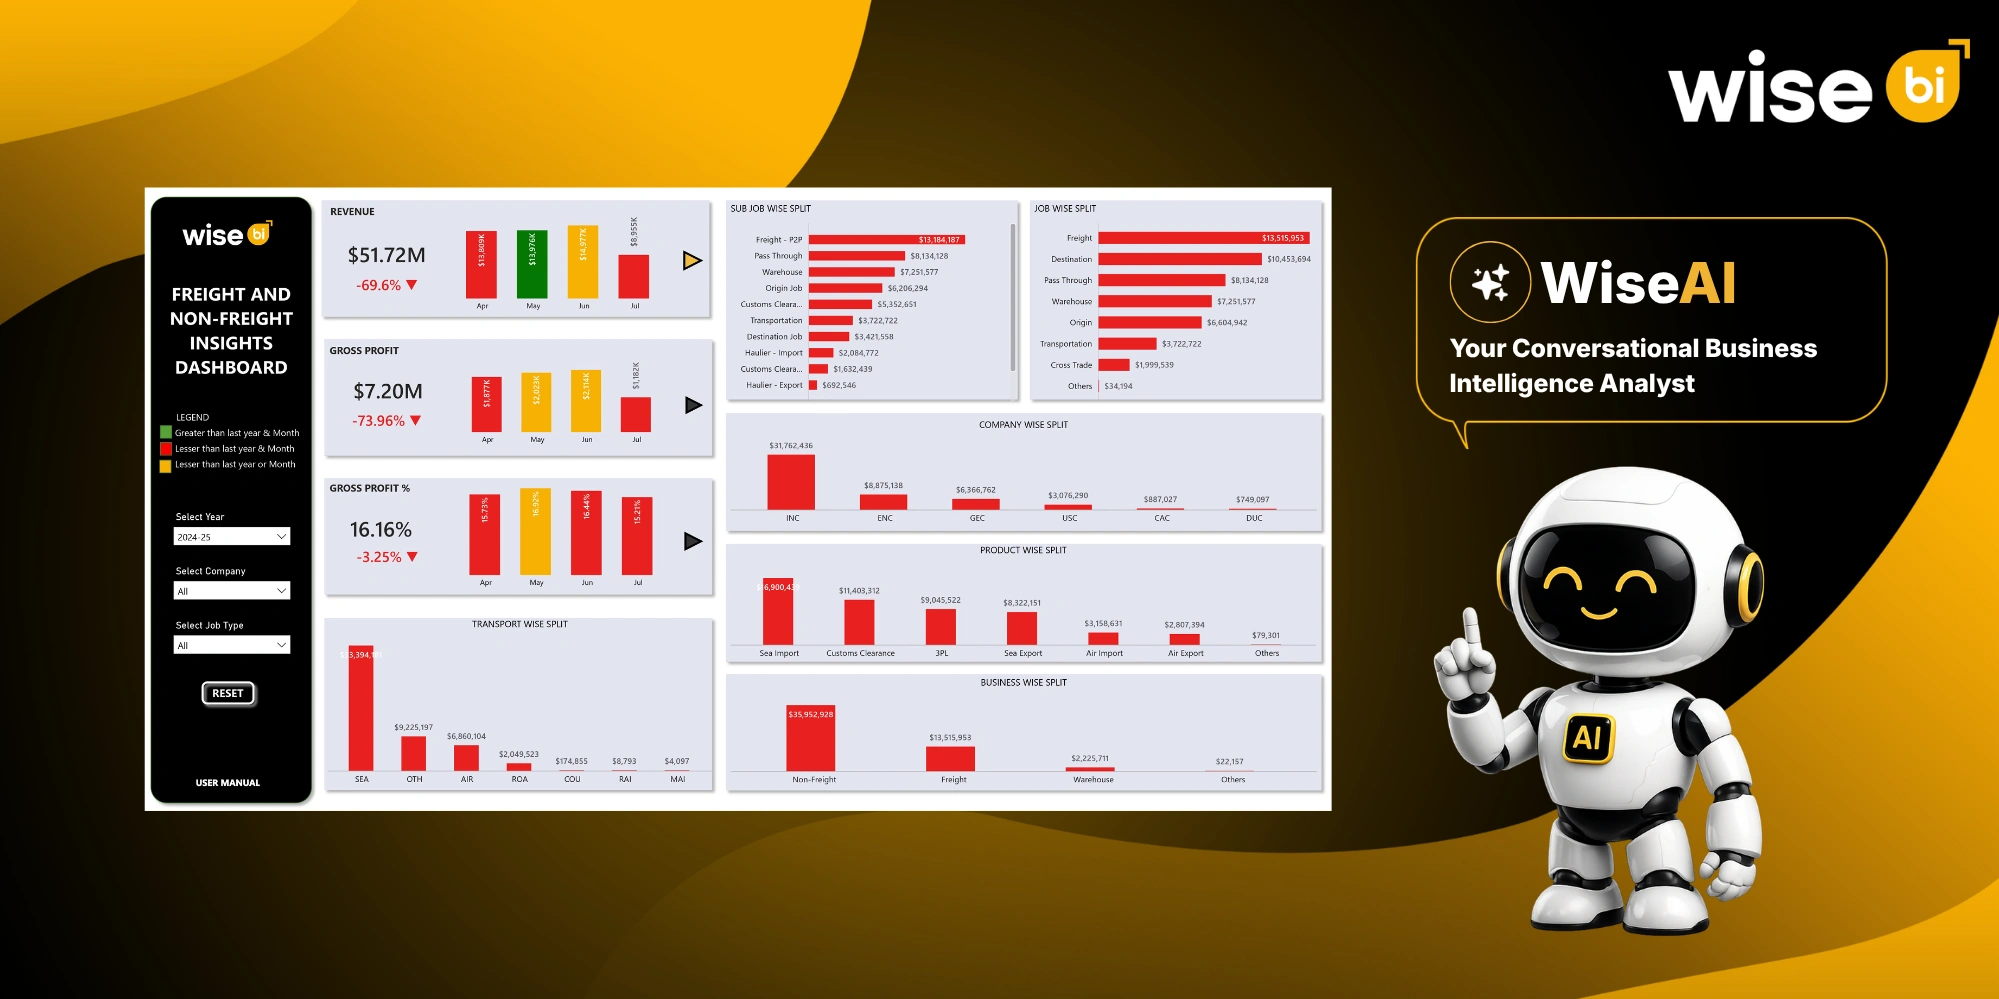
WiseBI’s CargoWise freight and non-freight insights dashboard combines these disparate performance views, allowing freight forwarders to better understand what drives revenue and profitability across the business.
What is a CargoWise Freight and Non-Freight Insights Dashboard?
A CargoWise Freight and Non-Freight Insights Dashboard is a centralized BI dashboard that helps freight forwarders compare the financial performance of freight and supporting non-freight activities.
The WiseBI dashboard brings together:
- Revenue
- Gross Profit
- Gross Profit %
- Previous-period differences
- Freight and non-freight business segments
- Job types
- Companies
- Transport modes
- Products
- Monthly and yearly trends
Instead of reviewing these areas separately, management can see how different parts of the organization contribute to overall business performance.
Why is Freight and Non-Freight Analysis Important?
A freight forwarding company can grow in revenue while still experiencing pressure on profitability.
For example, freight activities may generate most of the company’s revenue, while non-freight services contribute a smaller share but deliver stronger margins.
Without comparing both sides of the business, leadership may not see that difference clearly.
A freight and non-freight dashboard helps by:
- Showing where revenue is coming from
- Identifying stronger and weaker profit contributors
- Highlighting changes in business mix
- Revealing declining margins earlier
- Supporting better commercial and operational decisions
This gives management a much clearer understanding of whether business growth is actually improving financial performance.
Revenue, Gross Profit, and Gross Profit %
The top-level KPIs provide an immediate view of revenue, gross profit, and gross profit %.
Revenue shows how much business is being generated.
Gross profit shows how much remains after operational costs.
Gross Profit % provides additional context around profitability.
Seeing these measures together is important because revenue growth alone does not always indicate stronger business performance.
For example, revenue could rise significantly while gross profit % falls.
That tells management there may be an issue with costs, pricing, job mix, product performance, or transport mode contribution.
Instead of stopping at “Revenue increased,” the BI dashboard helps teams ask the more useful question:
Did that additional revenue create enough profit?
Freight and Non-Freight Business Split
One of the most useful views is the business segment split.
It allows users to compare freight and non-freight performance separately instead of viewing the company only as one total number.
This helps management understand:
- Which segment generates more revenue?
- Which contributes to stronger gross profit?
- Is freight or non-freight performance improving?
- How is the overall business mix changing?
This can be valuable when deciding where to focus sales activity, pricing reviews, service development, or additional investment.
Product-Level Performance
Different logistics products can generate very different financial results.
A product with high revenue may also carry higher costs.
Another product may generate lower revenue while delivering stronger margins.
The Product-level Insights dashboard view helps users compare performance across different service categories.
This makes it easier to identify:
- High-performing services
- Low-margin products
- Growing revenue opportunities
- Products showing declining profitability
Commercial teams can use this information to focus more attention on profitable services, while management can investigate areas where costs or pricing may need improvement.
Transport Mode Performance
Sea freight, air freight, road freight, courier, and other transport modes can all contribute differently to revenue and profitability.
The transport mode-wise split helps freight forwarders compare these differences.
For example, if air freight revenue rises sharply, leadership can also check whether gross profit and gross profit % improved.
If revenue rises but margin falls, the team has a clear reason to investigate further.
This connects operational activity with financial outcomes instead of treating them as separate reports.
Job Type Performance
Different job categories can also create different levels of value.
The job type-wise split shows how different types of jobs contribute to performance.
This can help management identify:
- Job categories generating strong revenue
- Areas with weaker profitability
- Business activities that may need pricing review
- Job types contributing to declining performance
This is particularly useful when overall gross profit changes but management needs to understand where that movement started.
Company-Level Performance
For freight forwarding groups with multiple companies or business entities, consolidated totals can hide individual performance issues.
The company-wise split helps users compare how each company contributes to revenue and profitability.
One company may deliver strong gross profit while another shows declining margins.
Without company-level visibility, the stronger entity could hide the weaker result.
This view helps leadership identify which companies are performing well and which need closer attention.
Monthly and Yearly Performance Trends
A single month does not always tell the full story.
The BI dashboard compares selected performance with previous periods and calculates the difference percentage.
Users can track revenue, gross profit, and gross profit % over time and quickly identify whether performance is moving in the right direction.
The dashboard also uses visual indicators:
- Green indicates stronger performance
- Red highlights decline
- Amber identifies mixed month-over-month and year-over-year movement
This makes developing problems easier to spot before they become larger issues.
How does WiseBI Help Freight Forwarders Understand Business Performance?
Brings Freight and Non-Freight Data Together
WiseBI creates one connected view of freight and non-freight performance.
Management no longer needs to rely only on separate reports to understand the overall business mix.
Identifies Hidden Profitability Issues
By comparing revenue with gross profit and gross profit percentage, the dashboard helps reveal situations where growth may look positive on the surface, but margins are weakening underneath.
Shows What is Driving Performance
Users can analyze performance by company, product, transport mode, job type, and business segment.
This helps teams identify the specific part of the organization responsible for growth or decline.
Reduces Manual Performance Reviews
Interactive filters and connected charts make it easier to analyze data without repeatedly exporting figures into spreadsheets.
Selecting a month, bar, or other chart element automatically updates related visuals.
Supports Faster Business Decisions
When teams can quickly see which services are growing, which margins are declining, and which business segments are contributing the most value, management can make decisions with better context.
WiseBI can also extend this experience through Conversational BI, allowing users to ask natural-language questions about their CargoWise performance and continue with follow-up analysis.
Conclusion
Freight forwarders already have valuable freight and non-freight data inside CargoWise.
The bigger challenge is making that data easier to understand.
A CargoWise Freight and Non-Freight Dashboard consolidates revenue, gross profit, gross profit percentage, products, job types, transportation modes, companies, business segments, and historical trends into a single, integrated view.
This helps management see where revenue is coming from, understand what is driving profitability, identify weaker areas sooner, and make better-informed commercial and operational decisions.
Want a clearer view of how your freight and non-freight activities are contributing to business performance? Schedule a free demo with WiseBI and see how your CargoWise data can become easier to analyze and act on.