


More shipments, higher revenue, but is your freight forwarding business performing as well as it appears?
Shipment growth can hide problems elsewhere. Jobs may remain open, invoices may go out late, and customer payments may take longer than expected. Looking at volume or revenue alone can leave these issues unnoticed.
Freight forwarders need to understand how reliably shipments move, how promptly jobs are completed and billed, and how effectively payments are handled.
The KPI dashboard brings these measures together, helping freight forwarders compare performance, identify gaps, and prioritize follow-ups.
This blog explains the operational, financial, and automation KPIs freight forwarders can track and how to use them in everyday business activities.
What is a KPI Dashboard for Freight Forwarders?
A key performance indicator (KPI) dashboard is a business intelligence tool that tracks performance against defined business goals.
It presents operational, financial, and service metrics through charts, percentages, and comparisons.
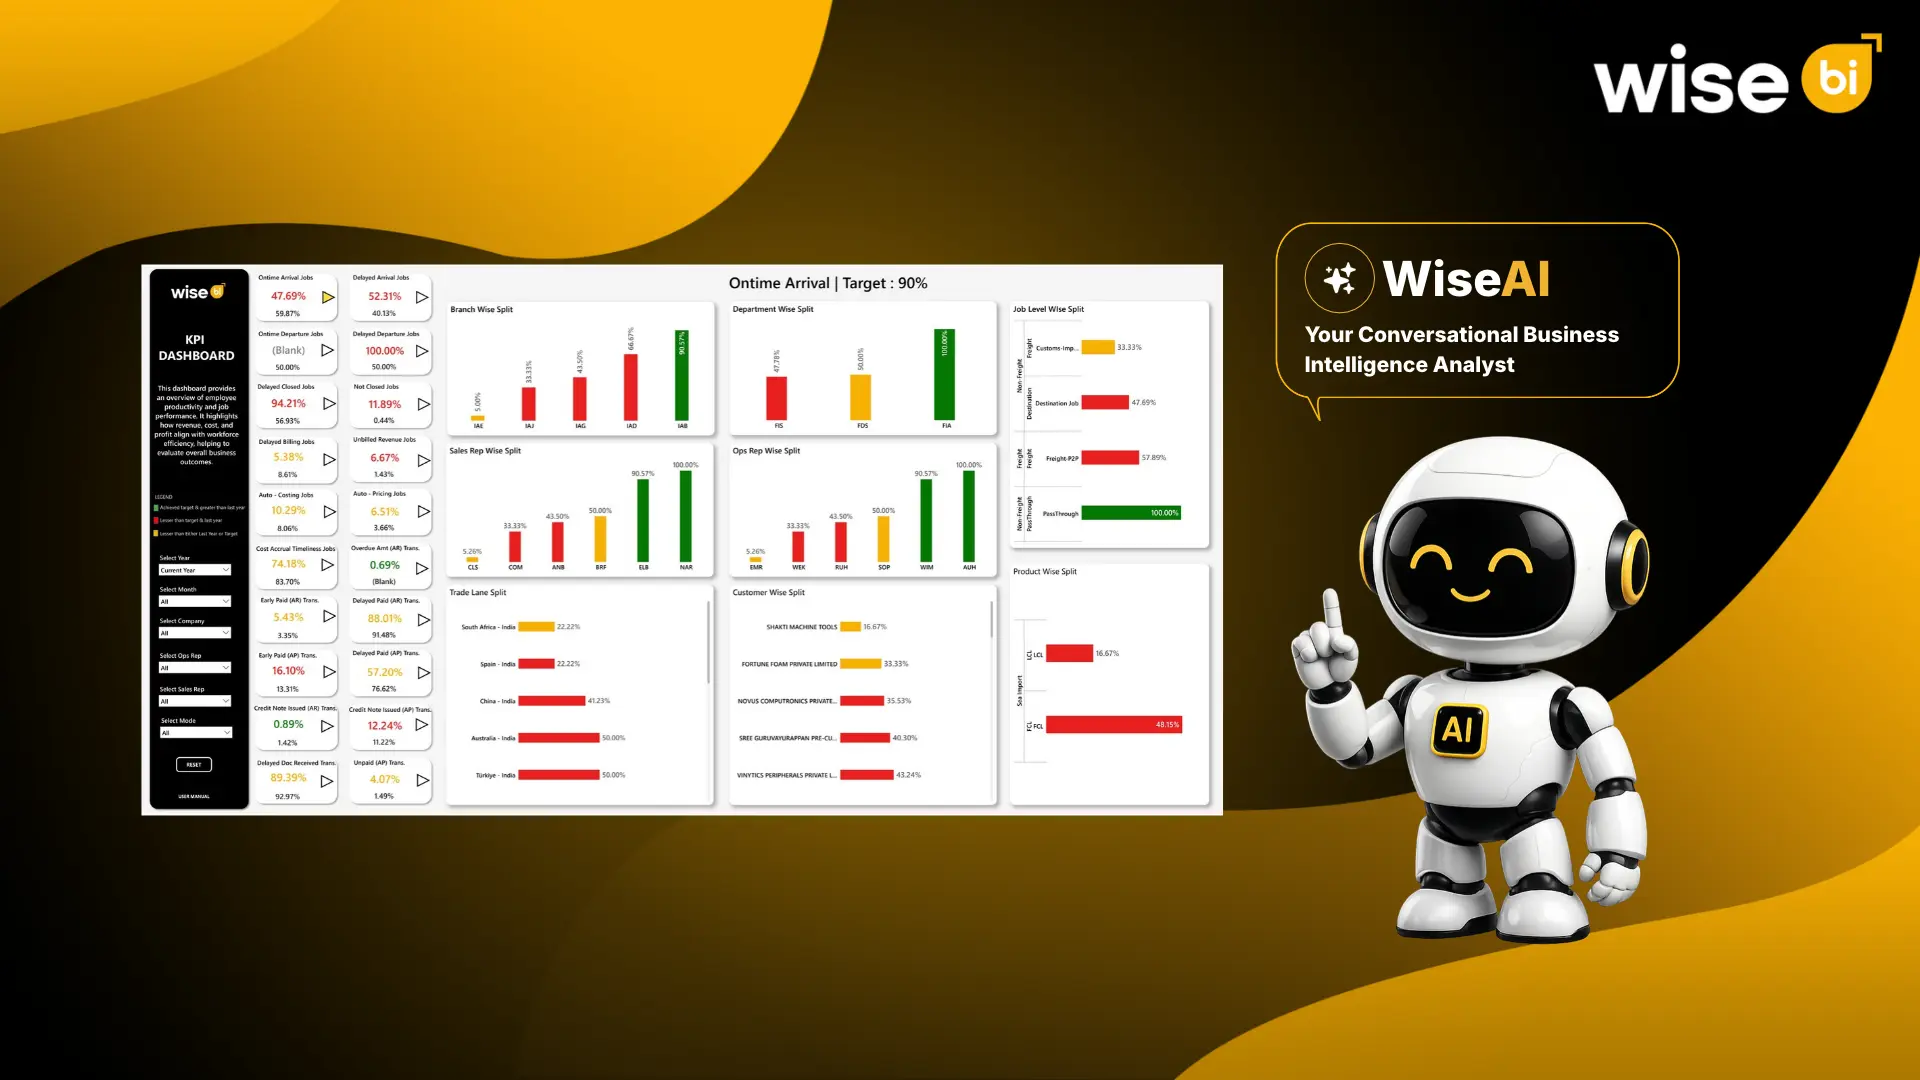
For CargoWise users, a KPI dashboard can bring together reporting data on shipment milestones, job completion, documentation, billing, cost accruals, receivables, payables, and automation.
Instead of evaluating departments separately, freight forwarders can review how operational activities influence financial processes.
For example, unresolved job details may hold up invoicing, depending on the company’s billing process. This can delay payment collection for completed work.
A useful KPI dashboard helps teams recognize these relationships and investigate the underlying issues.
What Operational KPIs Should Freight Forwarders Track?
Operational KPIs measure how reliably shipments and jobs move through the business. They help operations teams identify delays, evaluate workflows, and maintain service standards.
On-Time and Delayed Arrivals and Departures
The dashboard tracks four shipment timing measures: on-time arrival jobs, delayed arrival jobs, on-time departure jobs, and delayed departure jobs.
These indicators show whether shipments meet their scheduled milestones.
On-time performance (%) = (Eligible jobs meeting the agreed milestone ÷ Total eligible jobs) × 100
For example, if 90 out of 100 eligible jobs meet the arrival milestone, the on-time arrival rate is 90%.
Freight forwarders should review arrivals and departures separately because delays can occur at different stages. Consistent milestone definitions and timing tolerances make comparisons more meaningful.
Delayed Job Closures and Jobs Not Closed
Completing a shipment movement doesn’t necessarily mean the related job is ready to close.
Outstanding documentation, missing costs, or incomplete operational activities can keep jobs open.
The dashboard distinguishes between jobs closed late and jobs that remain open within the reporting scope.
Teams can use these indicators to identify backlogs, assign follow-ups, and investigate whether unresolved jobs are affecting financial processes.
Delayed Document Receipt
Freight forwarding depends on timely documentation throughout the shipment process.
The delayed document receipt indicator highlights transactions where documents were received after the expected deadline.
Monitoring this measure helps operations teams identify recurring documentation issues and follow up with the relevant parties.
What Financial KPIs Should Freight Forwarders Measure?
Financial KPIs show whether billing, cost recording, collections, and supplier payments are progressing as expected.
These measures are important because shipment activity, invoicing, and payment happen at different stages.
Delayed Billing and Unbilled Revenue Jobs
Completed work that hasn’t been invoiced can delay payment collection and create billing backlogs.
Delayed billing jobs identify jobs invoiced after the expected billing deadline.
Unbilled revenue jobs identify jobs associated with revenue that has not yet been billed, according to the dashboard’s reporting rules.
Tracking both helps finance teams prioritize billing follow-ups and investigate why invoicing is being held up. The job-based unbilled revenue indicator should be distinguished from the monetary value of unbilled revenue.
Cost Accrual Timeliness
Freight forwarding jobs may involve carrier charges, inland transport costs, handling fees, and other expenses.
When expected costs aren’t recorded within the required timeframe, job profitability figures may be incomplete.
Cost accrual timeliness helps finance teams identify gaps and follow up on expected charges that need to be recorded.
Accounts Receivable Performance
The dashboard includes four accounts receivable measures:
- Overdue amount (AR) transactions: Highlights overdue receivable transactions under the dashboard’s calculation rules.
- Early paid AR transactions: Tracks customer payments classified as early.
- Delayed paid AR transactions: Tracks customer payments classified as late.
- Credit note issued AR transactions: Tracks credit-note activity against customer transactions.
Together, these indicators help finance teams review collection performance, customer payment behavior, and billing adjustments.
Teams should investigate the reasons behind credit notes rather than assuming every credit note indicates an error.
Accounts Payable Performance
Supplier payments also require attention. Late payments can affect relationships with carriers, transport providers, and other logistics partners.
The dashboard includes four accounts payable measures:
- Early paid AP transactions: Tracks supplier payments classified as early.
- Delayed paid AP transactions: Tracks supplier payments classified as late.
- Unpaid AP transactions: Identifies supplier transactions that remain unpaid within the reporting scope.
- Credit note issued AP transactions: Tracks credit-note activity within accounts payable.
These measures help finance teams review payment timing and investigate exceptions.
Unpaid transactions are not necessarily overdue. Payment terms and due dates should be checked before follow-up action is taken.
Which Automation and Team Performance Measures can Freight Forwarders Review?
Operational and financial results depend on the employees managing shipments, completing documentation, and maintaining job records.
Automated Costing and Pricing
The dashboard tracks auto-costing jobs and auto-pricing jobs.
These indicators show the use of automated costing and pricing workflows across eligible jobs.
Freight forwarders can compare adoption and identify activities that still require manual intervention. However, automation rates should be considered alongside accuracy and exception handling.
Sales and Operations Representative Performance
Freight forwarders can analyze the selected KPI by the sales representative and operations representative.
For example, they can compare arrival performance or billing timeliness across the jobs associated with different representatives.
These comparisons should account for workload, shipment complexity, and assigned responsibilities rather than treating every job as equally demanding.
What can Freight Forwarders Filter and Compare?
A useful KPI dashboard combines core metrics with targets, historical comparisons, and performance breakdowns.
WiseBI’s dashboard provides the following options:
| Feature | What freight forwarders can review |
| Reporting period | Year and month |
| Company filter | Results for the selected company |
| Representative filters | Operations representative and sales representative |
| Mode filter | Results for the selected transport mode |
| Organizational breakdowns | Branch and department |
| Employee breakdowns | Sales representative and operations representative |
| Job and service breakdowns | Job level and product |
| Commercial breakdowns | Trade lane and customer |
| Performance comparisons | Targets and previous-year results |
The KPI selector allows users to choose the measure displayed across the breakdowns.
Color indicators provide context against targets and previous-year performance. Teams should interpret them according to the selected KPI because a higher percentage is not desirable for every measure.
How should Freight Forwarders Use KPI Dashboards to Improve Performance?
Tracking KPIs is useful only when the information leads to action.
For example, suppose a freight forwarding company targets 90% on-time arrivals, but one branch achieves only 75%.
The operations team can investigate the affected jobs and trade lanes to understand whether delays relate to carrier schedules, documentation, or operational coordination.
The same approach applies to financial KPIs.
If unbilled revenue jobs increase, finance and operations teams can check whether documents are missing, costs remain unresolved, or invoices are awaiting approval.
A practical review process involves identifying the performance gap, investigating its cause, assigning responsibility, and checking whether corrective action improves results.
How does WiseBI Further Enhance the KPI Dashboard Experience for Freight Forwarders?
Our BI dashboards bring operational and financial KPIs together, while WiseAI, a data intelligence assistant, makes them easier to explore through everyday questions. Freight forwarders can investigate performance without repeatedly navigating report pages or applying the same filters.
- Conversational analysis: Ask business questions without technical reporting skills.
- Context-aware follow-ups: Explore results further without repeating the original question.
- Visual answers: Review automatically generated charts, tables, and comparisons.
- Multilingual access: Ask questions and receive responses in more than 16 languages.
- Read-only access: Analyze data without creating, editing, or deleting operational records.
- Permission-based control: Receive answers only from data the user is authorized to view.
Conclusion
A successful freight forwarding business needs more than growing shipment volumes. Timely arrivals and departures, completed job records, prompt billing, accurate accruals, and well-managed payments all contribute to business performance.
WiseBI’s CargoWise KPI & Performance Dashboard brings these areas together through 20 measures, with breakdowns by branch, department, representative, customer, product, job level, and trade lane.
Use these views to identify where performance falls short, investigate the reasons, and assign clear follow-up actions. Reviewing the results regularly helps freight forwarders see whether those actions are making a difference.
Book a free demo with WiseBI to explore how the KPI dashboard can support your freight forwarding business.