


Financial Performance
Monitor current year actual, previous year actual, and budget performance.

Curated dashboards plus predictive insights that recommend your next move
Insights, playbooks and product thinking from the Wise BI team.

Monitor IFRS profit and loss performance against budgets, prior years, and key financial metrics from one connected dashboard.


The Problem
Financial performance is often reviewed through disconnected reports, making it difficult to compare actual results against budgets, previous years, and key IFRS performance indicators.

Comparing actual results with planned budgets requires multiple financial reports.

Financial changes across reporting periods are difficult to evaluate without connected comparisons.

Critical metrics such as EBITDA, DSO, DPO, and EBIT are often reviewed separately.

Manual reporting delays timely financial analysis and decision-making.
Solution: Integrated IFRS insight for confident decisions.
Capability Overview
The IFRS Profit & Loss Dashboard combines financial statements, executive KPIs, and variance analysis into one connected workspace. Instead of reviewing multiple financial reports, leadership gains real-time visibility into business performance, financial efficiency, and budget achievement.


Evaluate overall business performance.
 Review CY ActualCompare PY ActualAnalyze CY Budget

Understand financial performance against expectations.
Compare budget varianceReview year-over-year varianceIdentify performance gaps

Monitor key financial efficiency indicators.
Track EBITDAReview EBIT to GP %Monitor EBITDA to GP %Analyze DSO and DPO

Review the major components of financial performance.
Analyze total incomeCompare total expensesReview logistics services revenueMonitor freight expenses, net revenue, GP after other income, and SG&AMetric Index
Compare budget, prior-year, and current-year financial performance from executive summary to statement-level detail.
Financial Performance
Monitor current year actual, previous year actual, and budget performance.
Budget Variance
Measure performance against planned financial targets.
Year-over-Year Performance
Compare financial results with previous reporting periods.
Financial Efficiency
Track EBITDA, EBIT to GP %, EBITDA to GP %, DSO, and DPO.
Profit & Loss Performance
Review total income, logistics services revenue, freight expenses, and total expenses.
Profitability Performance
Analyze net revenue, GP after other income, EBITDA and SG&A.
Who Benefits from this Dashboard?

Monitor financial performance and strategic business outcomes.

Evaluate budgets, financial KPIs, and IFRS reporting performance.

Identify financial variances and improve reporting accuracy.

Compare financial performance across companies and reporting periods.
Our IFRS Profit & Loss Dashboard connects budgets, financial statements, executive KPIs, and variance analysis into one executive view. Instead of relying on static financial reports, leadership gains real-time visibility into financial performance and operational efficiency.
Key Outcomes:
 Compare the current year, the previous year, and budget performance.Monitor budget and year-over-year variances.Review EBITDA, DSO, DPO, and capital efficiency metrics.Analyze total income and operating expenses.Evaluate logistics services revenue and freight expenses.Monitor net revenue, GP after other income, and SG&A.Compare financial performance across reporting periods.Use WiseAI to investigate financial performance trends faster.

"Every financial insight helps leadership make faster, more confident business decisions."
Connects IFRS financial reporting with executive performance metrics.Combines budgets, actuals, and variance analysis in one dashboard.Interactive analysis by company, currency, year, month, and reporting mode.Monitors financial KPIs alongside IFRS financial statements.Pre-mapped with CargoWise financial data for zero manual report consolidation.Highlights financial performance through visual variance analysis.Supports faster executive reviews with connected financial insights.WiseAI enables natural-language financial performance analysis.Blogs, newsletters and case studies on CargoWise IFRS Profit & Loss Dashboard.
 Blog
Blog
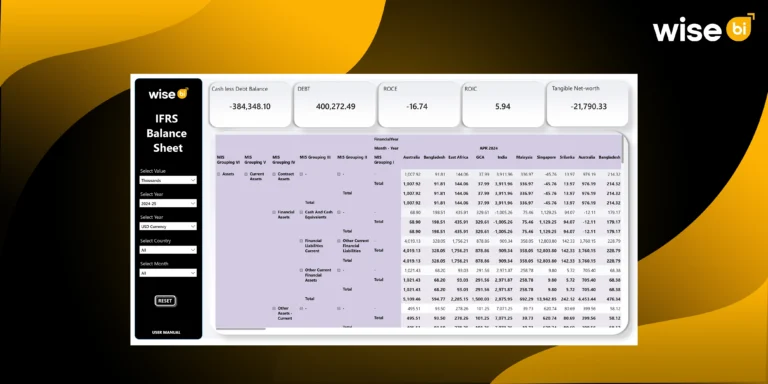
Financial reporting in logistics can easily become complicated. Freight forwarders handle thousands of transactions between customers, carriers, overseas agents, vendors, and branches. With multiple…
 Newsletter
Every transaction recorded in CargoWise tells part of your financial story. From customer invoices and supplier costs to receivables, payables, assets, liabilities, and cash…
 Blog
Blog
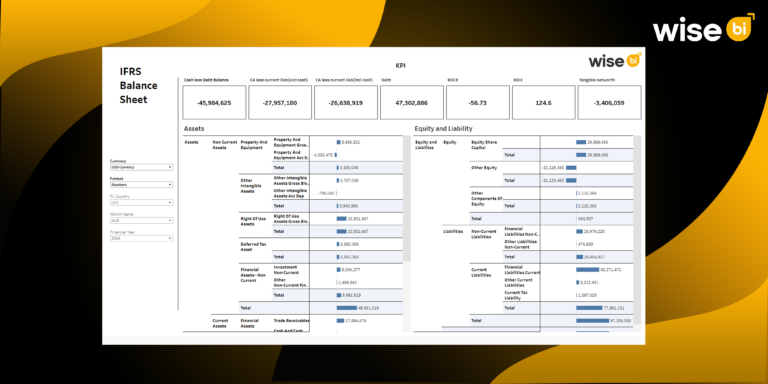
Have you ever thought of being able to examine your company’s finances perspicaciously, seeing beyond the numbers to determine where you stand? Managing financial…
Compare current year actual results with budgeted figures to identify financial variances and performance gaps.
You can review year-over-year comparisons across revenue, expenses, profitability, and executive financial KPIs.
You can track EBITDA, EBIT, GP%, EBITDA to GP%, DSO, DPO, and other key financial indicators from one dashboard.
Yes. Review total income, total expenses, logistics services revenue, freight expenses, net revenue, GP after other income, EBITDA, and SG&A in one connected view.
WiseAI helps you investigate financial trends, analyze variances, compare reporting periods, and explore business performance using natural-language questions.