


Consol Activity
Track total consolidation count, TEU, and volume.

Curated dashboards plus predictive insights that recommend your next move
Insights, playbooks and product thinking from the Wise BI team.

Gain complete visibility into your shipment consolidations, from profitability and customer contribution to operational performance and efficiency.


The Problem
Disconnected consolidation data makes it difficult for leaders to compare profitability, review customer contribution, and act with confidence each day.

Consolidation, job, volume, and financial data remain spread across separate reports.

Profitable, low-profit, and loss-making consolidations are difficult to separate quickly.

Top & Bottom customer contributions are missed without consolidated gross profit views.

Summary reports make it difficult to trace results to individual consolidations.
Solution: Unified visibility into shipment consolidation performance.
Capability Overview
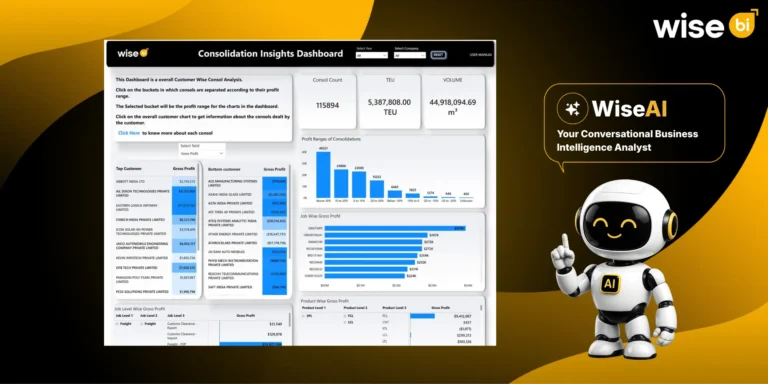
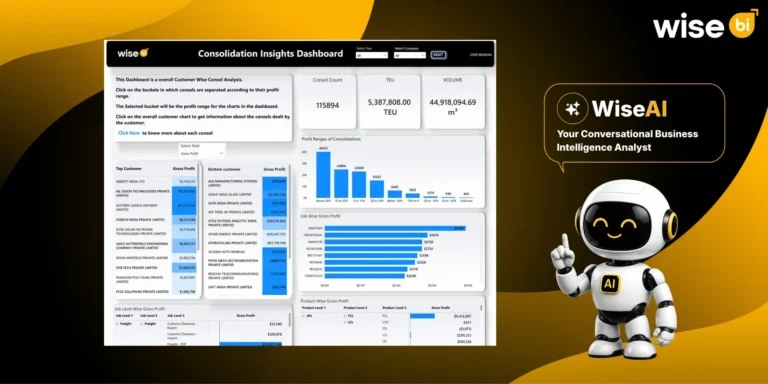
The Consolidation Performance Dashboard brings consolidation activity, financial performance, customer contribution, operational efficiency, and record-level detail into one interactive view, enabling real-time analysis from company-wide results to individual consolidations with complete clarity.


Monitor the overall health and performance of your complete consolidation operations network.
 Review consolidation countTrack TEU and volumeAnalyze revenue, cost, and gross profit

Understand how consolidations perform across different profit ranges, customers, and operational segments.
Review profit range bucketsIdentify profitable and loss-making consolidationsCompare consolidation GP performance

Evaluate financial contribution across customers, products, jobs, shipments, and operational service categories.
Compare customer-wise gross profitAnalyze product, job, and shipment performanceReview the top and bottom customers

Drill into every consolidation to understand detailed operational and financial performance clearly.
Review individual consolidation recordsMonitor average days and average hoursAnalyze trade lane and consolidation detailsMetric Index
Evaluate consolidation activity, profitability, and customer contribution from summary to record level.
Consol Activity
Track total consolidation count, TEU, and volume.
Financial Performance
Review revenue, cost, and gross profit across consolidations.
Profit Range Analysis
Identify profitable and loss-making consolidations by GP percentage.
Customer Performance
Compare top, bottom, and customer-wise gross profit.
Product and Job Performance
Analyze gross profit across product and job hierarchies.
Shipment and Consol Performance
Review shipment-wise gross profit and consolidation contribution.
Who Benefits from this Dashboard?

Monitor consolidation activity, profit ranges, and operational performance across all consolidation records.

Review volume, revenue, cost, gross profit, and consolidation efficiency to support day-to-day operations.

Evaluate customer contribution, compare top and bottom customers, and analyze customer-wise gross profit.

Track consolidation profitability, product performance, and job-level gross profit to support better decisions.
Our dashboard links consolidation activity, customer contribution, and financial performance, helping logistics leaders quickly identify profit ranges, customer trends, and operational gaps. Instead of reviewing separate reports, leaders can evaluate every consolidation in one place.
Key Outcomes:
 Review consolidation count, TEU, and volume together.Separate positive, negative, and unknown GP ranges.Compare top and bottom customers by gross profit.Analyze product, job, and shipment-wise contribution.Detect unusual GP patterns earlier with WiseAI.

"Every detail is designed to support real-world decision-making."
Synchronize CargoWise consolidation data in real time.Group consolidations into profit ranges for faster GP review.Drill down by customer, product, job, and shipment.Use WiseAI and clear visuals for faster consolidation analysis.Access automatically updated insights across desktop and mobile.Blogs, newsletters and case studies on CargoWise Consolidation Insights Dashboard.
 Blog
Blog
Moving more cargo through consolidations does not always result in a higher profit. One consol may be highly profitable, while another with similar volume…
 Blog
Blog
Freight consolidation can improve space utilization, reduce transportation costs, and help freight forwarders serve multiple customers more efficiently. However, managing and evaluating consolidation performance…
 Newsletter
Every day, your team is working inside CargoWise, creating shipments, managing jobs, and creating consolidations across different services and regions. From the outside, everything…
It measures consolidation count, volume, TEU, revenue, cost, gross profit, profit ranges, customer GP, product GP, job GP, and shipment GP.
Yes. The dashboard groups consolidations into profit range buckets, including positive, negative, and unknown ranges.
Yes. You can review customer-wise GP along with the top customer and bottom customer gross profit tables.
Yes. The drill-down view includes consolidation number, job number, product levels, job levels, volume, revenue, cost, and gross profit.
WiseAI helps users ask questions, review GP patterns, detect unusual changes, and investigate customer, product, job, or consolidation-level performance faster.