


Moving more cargo through consolidations does not always result in a higher profit.
One consol may be highly profitable, while another with similar volume may generate lower margins. When consolidation data is spread across CargoWise reports and job records, it becomes difficult to identify which consolidations are performing well and which need attention.
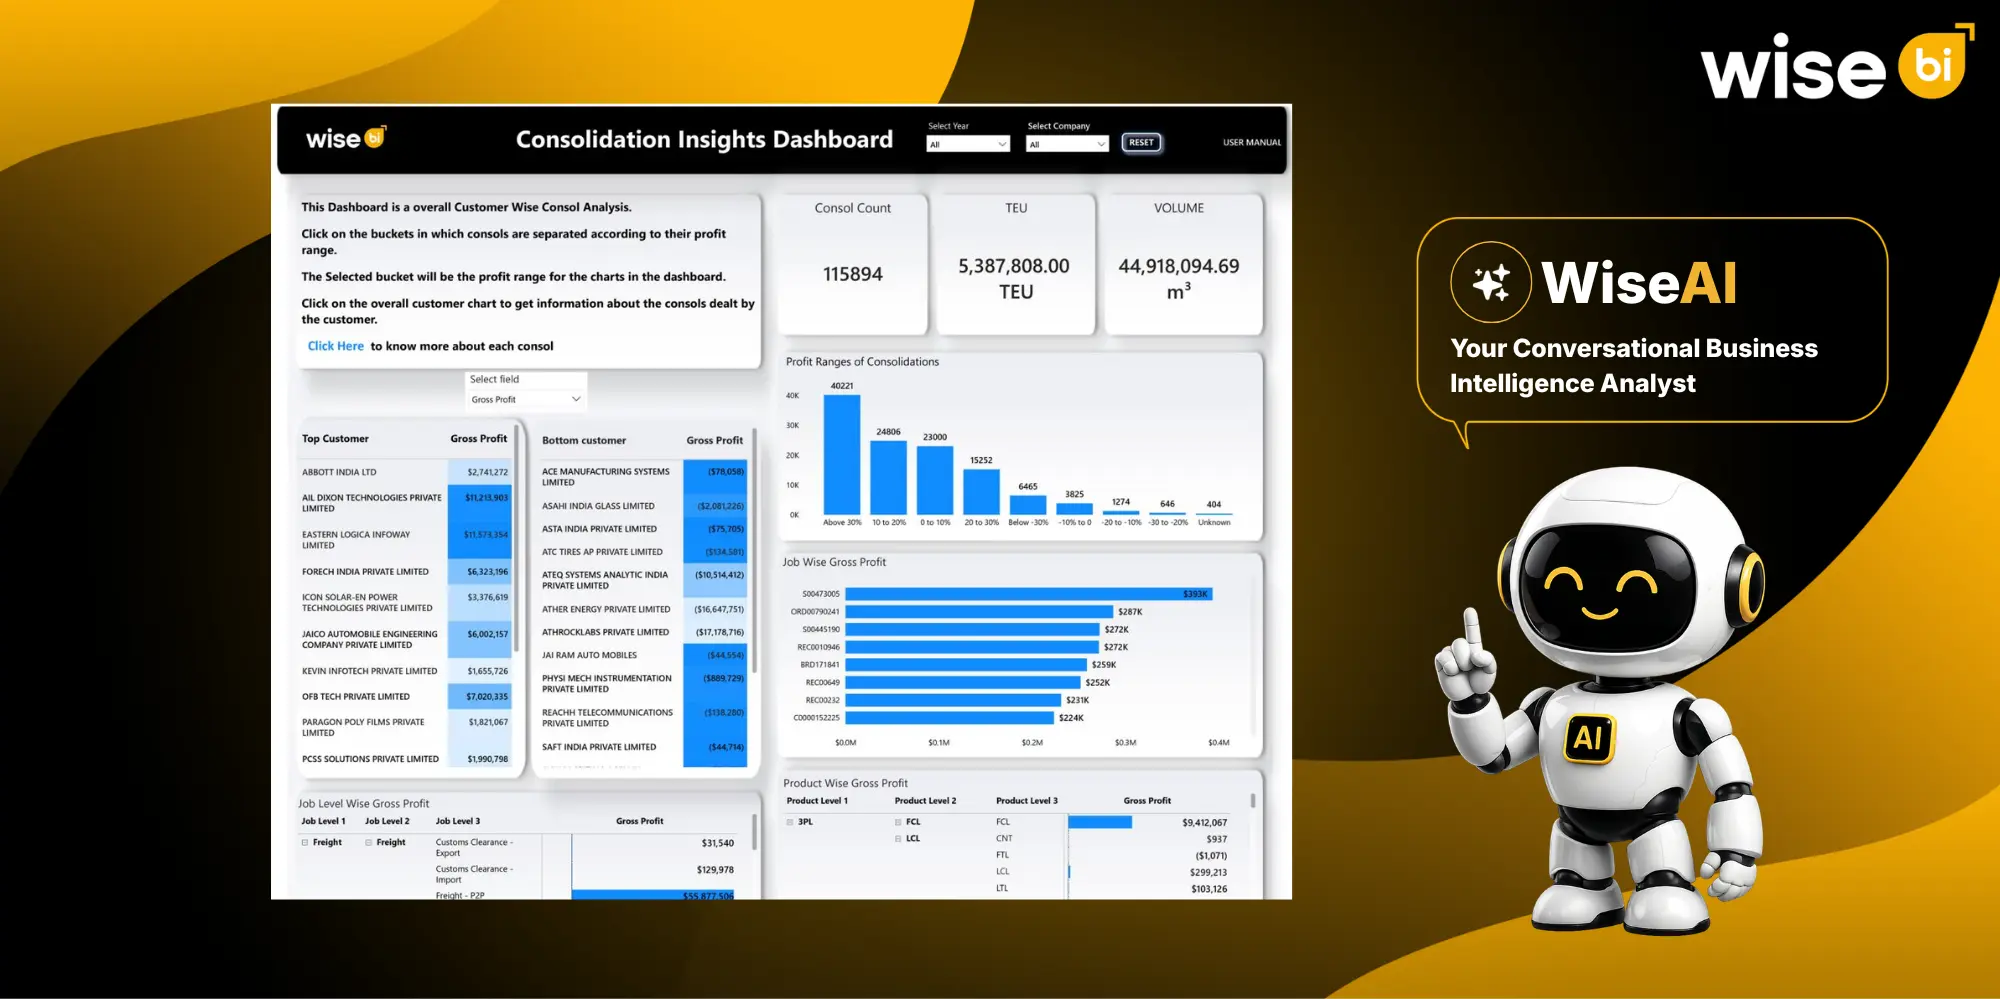
A CargoWise Consolidation Insights Dashboard enables freight forwarders to go beyond basic consolidation counts and gain insight into how each consol performs in terms of volume, profitability, customers, jobs, products, and processing times.
The BI dashboard doesn’t just show what happened. It assists operations, finance, commercial, and leadership teams in determining where performance is strong, margins are declining, and which consols require further investigation.
Important KPIs Tracked in the CargoWise Consolidation Insights Dashboard
Consolidation Count
The consolidation count shows the total number of consolidations handled during the selected period.
This KPI helps freight forwarders understand overall consolidation activity and compare workload across years or companies.
However, a higher consolidation count does not automatically mean stronger performance. Management should compare it with volume, revenue, cost, and gross profit to understand whether increased activity is producing commercial value.
Consolidation Volume
The dashboard tracks consolidation volume in cubic meters.
This helps teams understand how much cargo is being combined and moved through consolidation operations.
Volume analysis can reveal:
- Whether cargo activity is increasing or declining
- Whether consolidations are using available capacity effectively
- Whether larger volumes are generating better margins
- Whether warehouse and handling requirements are increasing
A high-volume consol may still produce a weak return if pricing, utilization, or cost recovery is poor.
TEU Volume
TEU volume provides visibility into container-related consolidation activity.
This KPI helps freight forwarders compare container utilization and understand how much full-container-equivalent volume is being handled.
It can support decisions around:
- Container planning
- Carrier allocation
- Space utilization
- Product performance
- Capacity requirements
TEU growth should be reviewed alongside gross profit to confirm whether higher container activity is also improving profitability.
Profit-Range Distribution
Profit-range distribution is one of the dashboard’s most important KPIs.
The dashboard separates consolidations into different margin bands, including strong positive margins, low positive margins, negative margins, and unknown results.
This helps management identify whether overall profit is supported by consistent performance or whether a few profitable consols are hiding many weak ones.
Users can focus on a selected profit range and investigate the customers, jobs, products, and consols behind it.
Customer-Wise Gross Profit
Customer-wise gross profit shows how much profit each customer contributes through consolidation activity.
This KPI helps freight forwarders move beyond customer volume and understand the actual commercial value of each account.
A customer may generate regular consols but still create weak profit because of:
- Low pricing
- Extra handling
- Special reporting
- Complex billing
- Repeated follow-up
- Additional warehouse or transport support
Profits from customer analysis enable better pricing, contract, and account management decisions.
Top-Customer Gross Profit
The top-customer view highlights accounts generating the strongest consolidation gross profit.
This helps commercial teams identify which customers contribute most to profitable growth.
These accounts may deserve:
- Stronger relationship management
- Additional service opportunities
- Retention focus
- More commercial support
- Long-term contract discussions
The KPI also helps management understand whether the business depends too heavily on a small number of profitable customers.
Bottom-Customer Gross Profit
The bottom-customer view identifies accounts producing weak or negative gross profit.
This is especially useful for detecting customers who generate activity without delivering a sustainable return.
Management can use this insight to review:
- Customer rates
- Additional service charges
- Cost recovery
- Operational effort
- Contract terms
- Billing accuracy
The purpose is not always to stop serving the customer. It is to understand why the relationship is underperforming and what needs to change.
Job-Wise Gross Profit
Job-wise gross profit shows which individual jobs contribute most or least to consolidation profitability.
This helps teams identify high-profit jobs, weak-margin jobs, and jobs where cost or revenue requires investigation.
A job with high cost and low revenue may indicate:
- Missing billing
- Incorrect cost allocation
- Unexpected supplier charges
- Pricing errors
- Incomplete job closure
This KPI gives finance and operations teams a more focused place to begin their review.
Job-Level Gross Profit
The dashboard also analyzes gross profit across different job levels.
These may include freight, non-freight, customs clearance, cross-trade, freight point-to-point, and other operational activities.
This helps management understand where consolidation profit is being created within the wider process.
For example, the main freight movement may be profitable while supporting customs or transport work is underpriced.
Job-level profit analysis makes it easier to determine which services require pricing, billing, or process reviews.
Product-Wise Gross Profit
Product-wise gross profit compares consolidation performance across products, such as:
- FCL
- LCL
- LTL
- FTL
- 3PL
- OBC
- LSE
- Other product categories
This KPI helps freight forwarders understand which products generate strong returns and which carry weak margins.
It can support decisions around:
- Product pricing
- Carrier negotiations
- Sales priorities
- Service development
- Capacity utilization
- Operational support
Growing volume in a product is only valuable when that growth also supports profit.
Consolidation-Wise Gross Profit
Consolidation-wise, gross profit shows the financial result of each individual consol.
This allows users to identify which consolidations performed well and which require investigation.
It is particularly useful when management wants to move from a broad profit-range result to a specific consolidation number.
The team can then review the related jobs, customers, products, revenue, costs, and volume.
Revenue
Revenue shows the income recorded against the selected consolidation or job.
Revenue should always be reviewed together with cost and gross profit.
A consolidation may show strong revenue but still produce a weak margin if costs are too high. A consol with little or no revenue but recorded costs may point to missing billing or delayed posting.
Cost
Cost shows the expenses connected with the consolidation or job.
These costs may include freight, carrier, handling, warehouse, customs, transport, and other operational charges.
Unusually high cost may indicate:
- Unexpected carrier charges
- Poor capacity utilization
- Incorrect cost allocation
- Additional handling
- Supplier-rate changes
- Operational inefficiency
Cost visibility helps teams understand why a seemingly busy consolidation produced a weak return.
Gross Profit
Gross profit shows the difference between revenue and cost.
This is one of the most important commercial KPIs in the dashboard because it shows whether a consolidation actually created value.
Gross profit can be reviewed by:
- Customer
- Job
- Job level
- Product
- Consolidation
- Company
- Year
- Trade lane
This helps management identify the exact area driving profit or loss.
Average Consolidation Days
Average consolidation days show how long consolidations remain in process.
This KPI helps operations teams identify whether consols are taking longer than expected to complete.
Longer processing times may result from:
- Missing documents
- Delayed customer instructions
- Customs issues
- Carrier delays
- Late cost posting
- Slow job closure
Long-running consols may increase operational effort and reduce productivity.
Average Consolidation Hours
Average consolidation hours provide a more detailed time-based view.
This is useful when managers need to compare shorter operational differences that may not be clear when measured only in days.
It can help identify which consols, customers, products, or trade lanes require more time and operational attention.
Consol-Level Drill-Down Details
The drill-down view provides the detailed records behind the dashboard result.
Users can review:
- Consolidation number
- Job number
- Product levels
- Job levels
- Volume
- Revenue
- Cost
- Gross profit
This helps teams move from identifying a problem to finding its exact cause.
Performance by Company, Year, and Trade Lane
Users can filter the dashboard by year, company, consolidation number, selected metric, and trade-lane country.
These filters help management determine whether a problem is limited to one company, period, customer group, trade lane, or consolidation.
They also make the dashboard more relevant to each decision-maker.
Conversational BI Analysis
WiseBI’s Conversational Business Intelligence allows users to explore dashboard KPIs using natural-language questions.
For example:
- Which customers generated the lowest consolidation gross profit?
- Which consols fall into negative profit ranges?
- Which products produced the strongest margins?
- Which consolidations took the longest to complete?
- Which jobs recorded high costs but low revenue?
Users can then ask follow-up questions without rebuilding the analysis or applying several filters manually.
Conclusion
A CargoWise Consolidation Insights Dashboard helps freight forwarders track far more than consolidation volume.
It brings together consolidation count, cargo volume, TEUs, profit ranges, customer performance, job and product profitability, revenue, cost, gross profit, processing time, trade-lane performance, and consol-level drill-down details.
These KPIs help teams identify where profit is being created, where margin is weakening, and which exact customer, product, job, or consolidation requires action.
Book a free demo with WiseBI to see how the CargoWise Consolidation Insights Dashboard can help your team track the right KPIs, investigate weak performance, and make better consolidation decisions.