


User Activity
Track login counts, transaction creation, and employee engagement.

Curated dashboards plus predictive insights that recommend your next move
Insights, playbooks and product thinking from the Wise BI team.

Understand how your teams use your logistics platform through connected user activity and operational insights.


The Problem
As logistics operations grow, understanding how employees interact with business systems becomes increasingly complex. Traditional reports often show isolated activity instead of providing a complete picture of workforce engagement.

Organizations struggle to understand how actively employees use different business modules.

Login activity, transaction creation, and employee participation are often reviewed separately.

Weekly and monthly activity patterns can go unnoticed without centralized reporting.

Without connected insights, identifying departments, branches, or users requiring additional support becomes challenging.
Solution: Integrated insight into platform user activity.
Capability Overview
The User Activity Dashboard combines user engagement, transaction activity, login behavior, and workforce analytics into one connected workspace. Leadership can understand how employees interact with operational systems, identify usage patterns, and improve overall platform adoption.


Measure how employees interact with business applications.
 Monitor login activityTrack active user participationReview employee engagement

Understand operational system usage.
Analyze transaction creationCompare employee activityReview workload distribution

Evaluate system usage across the business.
Compare branch performanceAnalyze department activityReview company-wide adoption

Track workforce behavior over time.
Monitor weekly activityReview monthly trendsAnalyze module utilizationMetric Index
Track login activity, transaction creation, and platform adoption from company summary to weekly detail.
User Activity
Track login counts, transaction creation, and employee engagement.
Workforce Participation
Measure employee activity and organizational adoption.
Module Utilization
Analyze how business modules are being used across operations.
Department Activity
Compare user activity across operational departments.
Branch and Company Usage
Evaluate system adoption across branches and companies.
Activity Trends
Monitor weekly and monthly user behavior.
Who Benefits from this Dashboard?

Gain visibility into workforce engagement and platform adoption.

Monitor employee activity and identify operational trends.

Understand system usage and support user adoption.

Evaluate team participation and workload across business functions.
The User Activity Dashboard connects user behavior, transaction activity, workforce participation, and system utilization into one executive workspace. Instead of relying on isolated activity logs, leadership gains meaningful insights into how operational teams use business systems every day through.
Key Outcomes:
 Monitor transaction creation and login activity.Compare user engagement across branches and departments.Compare employee transaction and login activity.Analyze module adoption across business functions.Identify weekly and monthly activity trends.Evaluate company-wide system usage.Investigate employee activity through detailed operational views.Use WiseAI to identify adoption trends, user behavior patterns, and opportunities to improve operational efficiency.

"Better user visibility creates stronger operational performance."
Provides interactive visibility into module utilization and operational activity.Tracks workforce engagement across employees, departments, branches, and companies.Connects transaction creation and login behavior in one unified dashboard.Enables leadership to identify adoption trends and user activity patterns.Supports detailed analysis by year, month, company, week, and activity type.Compares employee participation across operational functions.Pre-mapped with CargoWise user activity data for seamless reporting.WiseAI enables natural-language analysis of platform adoption and user behavior.Blogs, newsletters and case studies on CargoWise User Activity Dashboard.
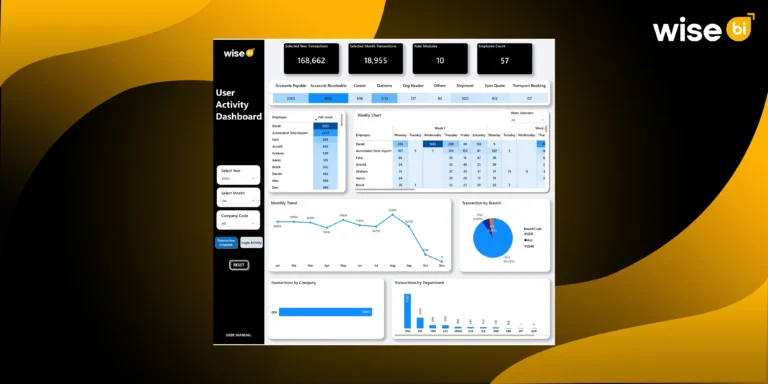 Blog
Blog
“Great logistics leaders don’t guess—they act on data.” In the current logistics environment, visibility has emerged as one of the most significant competitive advantages.…
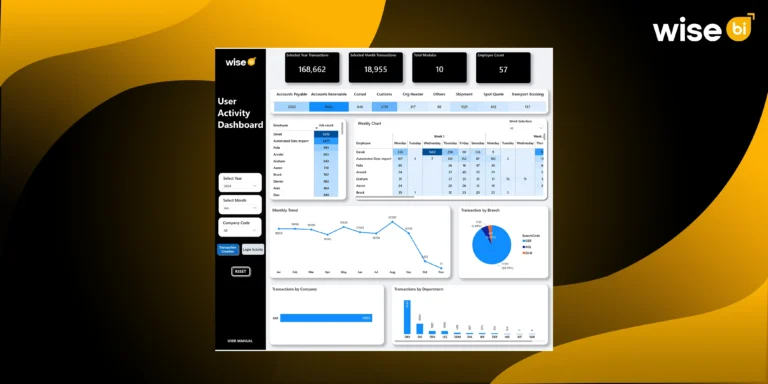 Blog
Blog
High visibility is the key to efficient operations. When teams handle thousands of updates, transactions, and system interactions per day, leaders require more than…
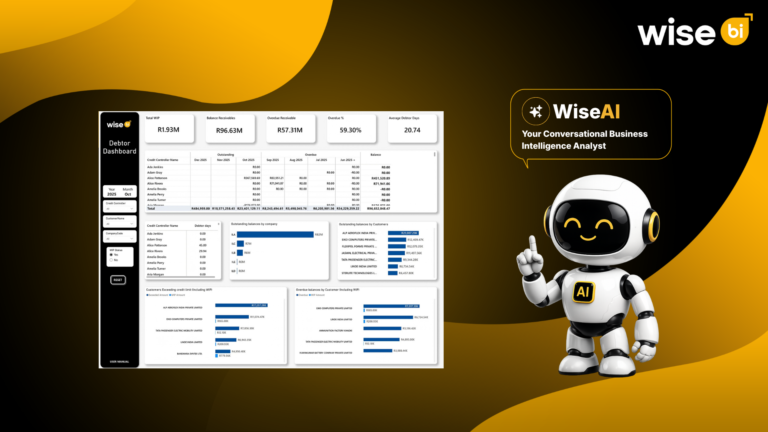 Blog
Blog
Revenue is recorded when the invoice is raised, but cash flow improves only when the customer pays. A completed freight job does not mean…
Track login activity, transaction creation, and user participation through one connected dashboard.
Compare user activity across departments, branches, and companies to understand platform adoption.
Review weekly and monthly activity trends to identify usage patterns and operational consistency.
Yes. The dashboard provides visibility into module utilization, transaction activity, and employee participation across operational functions.
WiseAI helps identify user behavior trends, monitor adoption levels, investigate workforce engagement, and answer operational questions using natural-language queries.