


Revenue
Track total revenue across every branch.

Curated dashboards plus predictive insights that recommend your next move
Insights, playbooks and product thinking from the Wise BI team.

Analyze your branch performance from every business perspective in one connected dashboard every single day.


The Problem
Branch performance is often reviewed through separate financial and operational reports, making it difficult to understand which locations contribute most to business growth.

Revenue, gross profit, and branch activity are reviewed across multiple reports.

Products, transport modes, and business segments are difficult to evaluate alongside branch performance.

Job and sub-job contributions are not easily connected to branch results.

Monthly business reviews require manual consolidation before meaningful comparisons can begin.
Solution: Unified branch performance and contribution visibility.
Capability Overview
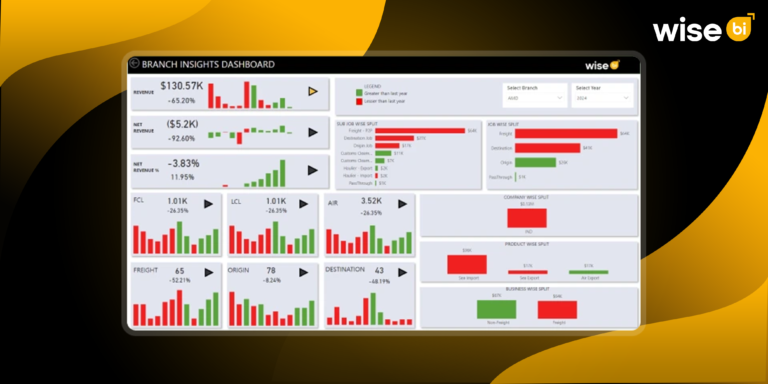
The Branch Insights Dashboard connects financial performance and operational activity across branches in one view. Instead of reviewing multiple reports, leadership gains real-time branch performance visibility across revenue, gross profit, GP%, products, transport modes, jobs, sub-jobs, and business segments.


Evaluate the financial health of every branch.
 Track revenue and gross profitMonitor GP%Compare monthly financial trends

Compare business contributions across locations.
Review branch-wise revenueCompare branch performanceMeasure business contribution

Understand the operational activities behind branch performance.
Analyze job-wise contributionReview sub-job distributionCompare operational categories

Understand what drives branch growth.
Review product-wise contributionCompare business segmentsAnalyze transport-wise distributionMetric Index
Monitor branch revenue, profitability, and business contribution from summary to record level.
Revenue
Track total revenue across every branch.
Gross Profit
Measure gross profit and GP%.
Branch Contribution
Compare revenue generated by each branch.
Job Contribution
Review operational contribution across job categories.
Sub-Job Contribution
Analyze detailed operational activities.
Product Contribution
Measure the business generated by each logistics service.
Business Mix
Compare freight, warehouse, non-freight, and other business segments.
Transport Mix
Review contributions across sea, air, road, courier, rail, and other transport modes.
Who Benefits from this Dashboard?

Monitor revenue, gross profit, and branch contribution across the logistics business.

Analyze job, sub-job, product, and transport activity across branches.

Track revenue, gross profit, and GP% by branch and reporting period.

Compare branch performance and understand what drives business contribution.
Our Branch Insights Dashboard connects branch revenue, gross profit, GP%, business contribution, operational activity, and service distribution into one executive view. Instead of reviewing disconnected branch reports, leadership gains real-time branch performance visibility.
Key Outcomes:
 Compare revenue and gross profit across branches.Pre-organized with CargoWise data structures for zero manual consolidation.Review branch-wise contribution across the network.Analyze product and business segment performance.Measure transport mode contribution by branch.Understand the job and sub-job activity behind branch results.Track monthly and year-over-year performance changes.Use WiseAI to investigate branch trends and performance gaps faster.

"Every insight is built to help leaders understand branch performance faster."
Consolidates branch revenue, gross profit, and GP% into one view.Interactive analysis by company, branch, and year.Branch-wise split for fast business comparison.Job-wise and sub-job-wise performance visibility.Product, business, and transport contribution analysis.Pre-mapped with CargoWise structures for zero manual consolidation.Clear visuals and indicators for faster interpretation.WiseAI supports natural-language performance analysis.Blogs, newsletters and case studies on CargoWise Branch Insights Dashboard.
 Blog
Blog
Managing multiple branches in today’s competitive logistics landscape means balancing a lot of moving parts. Whether it’s monitoring revenue, tracking shipments, or ensuring operational…
 Blog
Blog
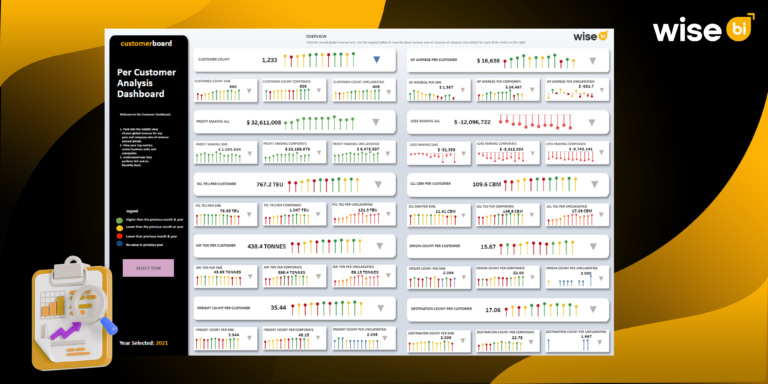
A comprehensive understanding of your branch-level freight volume is essential for preserving operational effectiveness and profitability in the evolving logistics sector of today. You…
 Blog
Blog
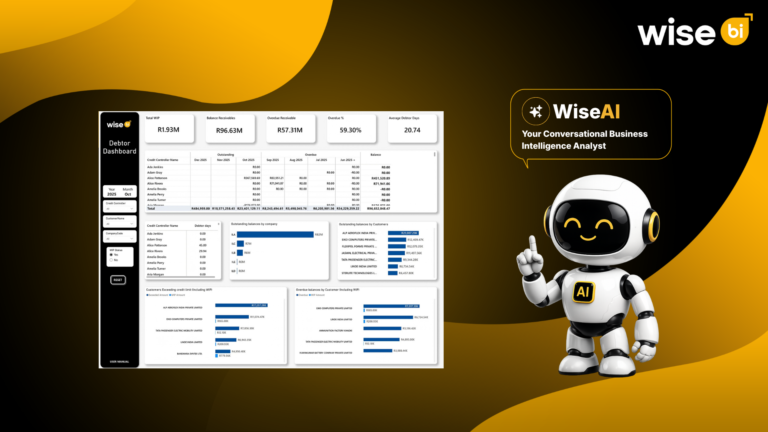
Revenue is recorded when the invoice is raised, but cash flow improves only when the customer pays. A completed freight job does not mean…
The Branch Insights Dashboard compares branches using revenue, gross profit, GP%, products, transport modes, jobs, and business contribution from one viewpoint.
Yes. You can compare branch-wise revenue, gross profit, and profitability to identify top-performing branches.
Yes. Review product, business, transport, job, and sub-job contributions to understand what influences branch results.
Yes. Compare monthly and year-over-year trends to monitor changes in branch performance.
WiseAI lets you ask questions in natural language, identify performance trends, investigate branch differences, and uncover business insights faster.