


FCL and LCL Volume
Measure containerized freight in TEUs and cubic metres.

Curated dashboards plus predictive insights that recommend your next move
Insights, playbooks and product thinking from the Wise BI team.

Get visibility into freight volume, operational movement, and volume insights across your logistics business in one dashboard.


The Problem
Disconnected operational data makes it difficult for leaders to compare freight volume, identify trends, and plan resources confidently across operations.

Volume data remains spread across branches, transport modes, products, and business units.

Shipment counts rarely explain how freight volume is distributed across services and logistics movements.

Manual reporting makes it difficult to identify declining volumes and operational shifts early.

Without consolidated insights, resource, equipment, and operational planning become reactive.
Solution: Connected freight volume and operational visibility.
Capability Overview
The Volume Insights Dashboard brings freight volume, transport modes, companies, products, business units, and operational activity into one interactive view, enabling real-time analysis across the entire logistics network or any single branch at any time.


Measure freight volume using the appropriate operational unit for each transport mode.
 Track FCL volume in TEUsMeasure LCL volume in cubic metresMonitor airfreight volume in tonnes

Understand how freight volume is distributed across companies, branches, and business operations.
Analyze company-wise volumeCompare freight, non-freight, and warehouse activityMeasure business-wise contribution

Evaluate operational freight volume across logistics products, services, and primary transport modes.
Compare product-wise volumeAnalyze transport-wise activityReview service-level contribution

Drill into operational activities to understand freight movement across every reporting level.
Review job and sub-job volumeAnalyze origin and destination movementsCompare transportation, cross-trade, and warehouse operationsMetric Index
Measure freight volume and operational distribution across your logistics network from summary to record level.
FCL and LCL Volume
Measure containerized freight in TEUs and cubic metres.
Airfreight Volume
Monitor air cargo volume in tonnes and transaction activity.
Origin and Destination Volume
Analyze freight movement patterns.
Job and Sub-Job Performance
Understand operational workload distribution.
Company and Business Performance
Compare volume across business categories.
Product and Transport Analysis
Evaluate service and transport volume.
Who Benefits from this Dashboard?

Monitor freight volume and operational trends across the business.

Compare branch-level volume and location-wise activity.

Evaluate volume across products, transport modes, and business units.

Analyze freight distribution to support planning and resource allocation.
Our dashboard links freight volume, transport activity, and operational distribution, helping logistics leaders quickly identify trends, volume changes, and movement patterns. Instead of relying on fragmented reports, leaders can act on complete volume visibility.
Key Outcomes:
 Compare volume distribution across companies and branches.Analyze FCL, LCL, and airfreight volume separately.Evaluate transport mode performance across the logistics network.Assess product, business, origin, and destination contribution.Track monthly trends and spot anomalies earlier with WiseAI.

"Every detail is designed to support real-world decision-making."
Synchronize CargoWise freight volume data in real time.Track mode-wise volume for FCL, LCL, and airfreight.Drill down by company, branch, product, and transport mode.Use WiseAI and clear visuals for faster volume analysis.Access automatically updated insights across desktop and mobile.Blogs, newsletters and case studies on CargoWise Volume Analysis Dashboard.
 Newsletter
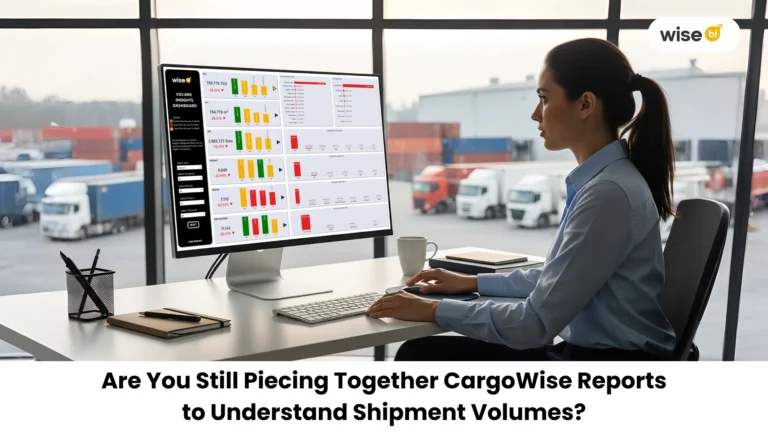
Every day, your team works in CargoWise, creating jobs, managing shipments, and tracking volumes by TEU, tonnage, and cubic measurement. Data is present. There…
 Blog
Blog
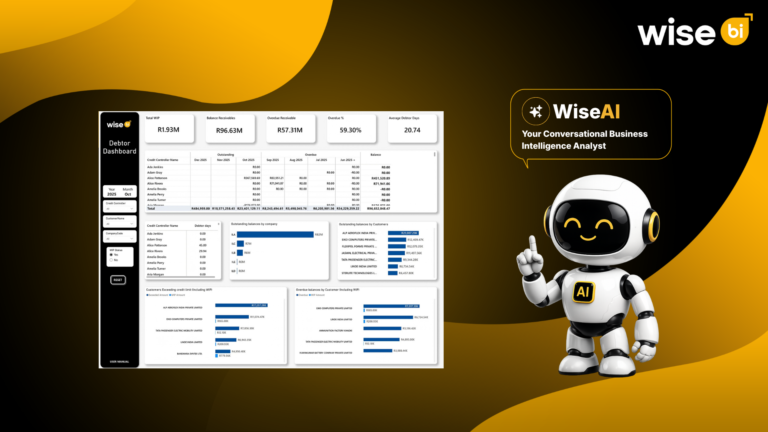
Revenue is recorded when the invoice is raised, but cash flow improves only when the customer pays. A completed freight job does not mean…
 Blog
Blog
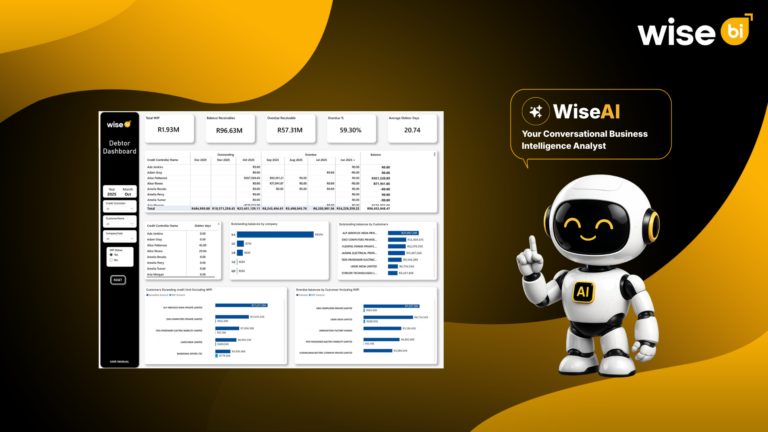
For a freight forwarder, completing a shipment and issuing an invoice are only part of the financial cycle. The job truly turns into cash…
The dashboard automatically syncs with your connected CargoWise data, providing up-to-date freight volume and operational insights without manual report generation.
Yes. The dashboard tracks FCL in TEUs, LCL in cubic meters (m³), and airfreight in tonnes, allowing accurate mode-specific volume analysis.
Yes. You can analyze freight volume using filters such as company, branch, product, transport mode, business unit, and reporting period.
Yes. You can drill down into job and sub-job activity, along with origin, destination, product, and business-wise volume, to understand operational distribution.
WiseAI enables you to ask questions in natural language, uncover volume trends, identify unusual operational patterns, and gain faster insights from your logistics data.