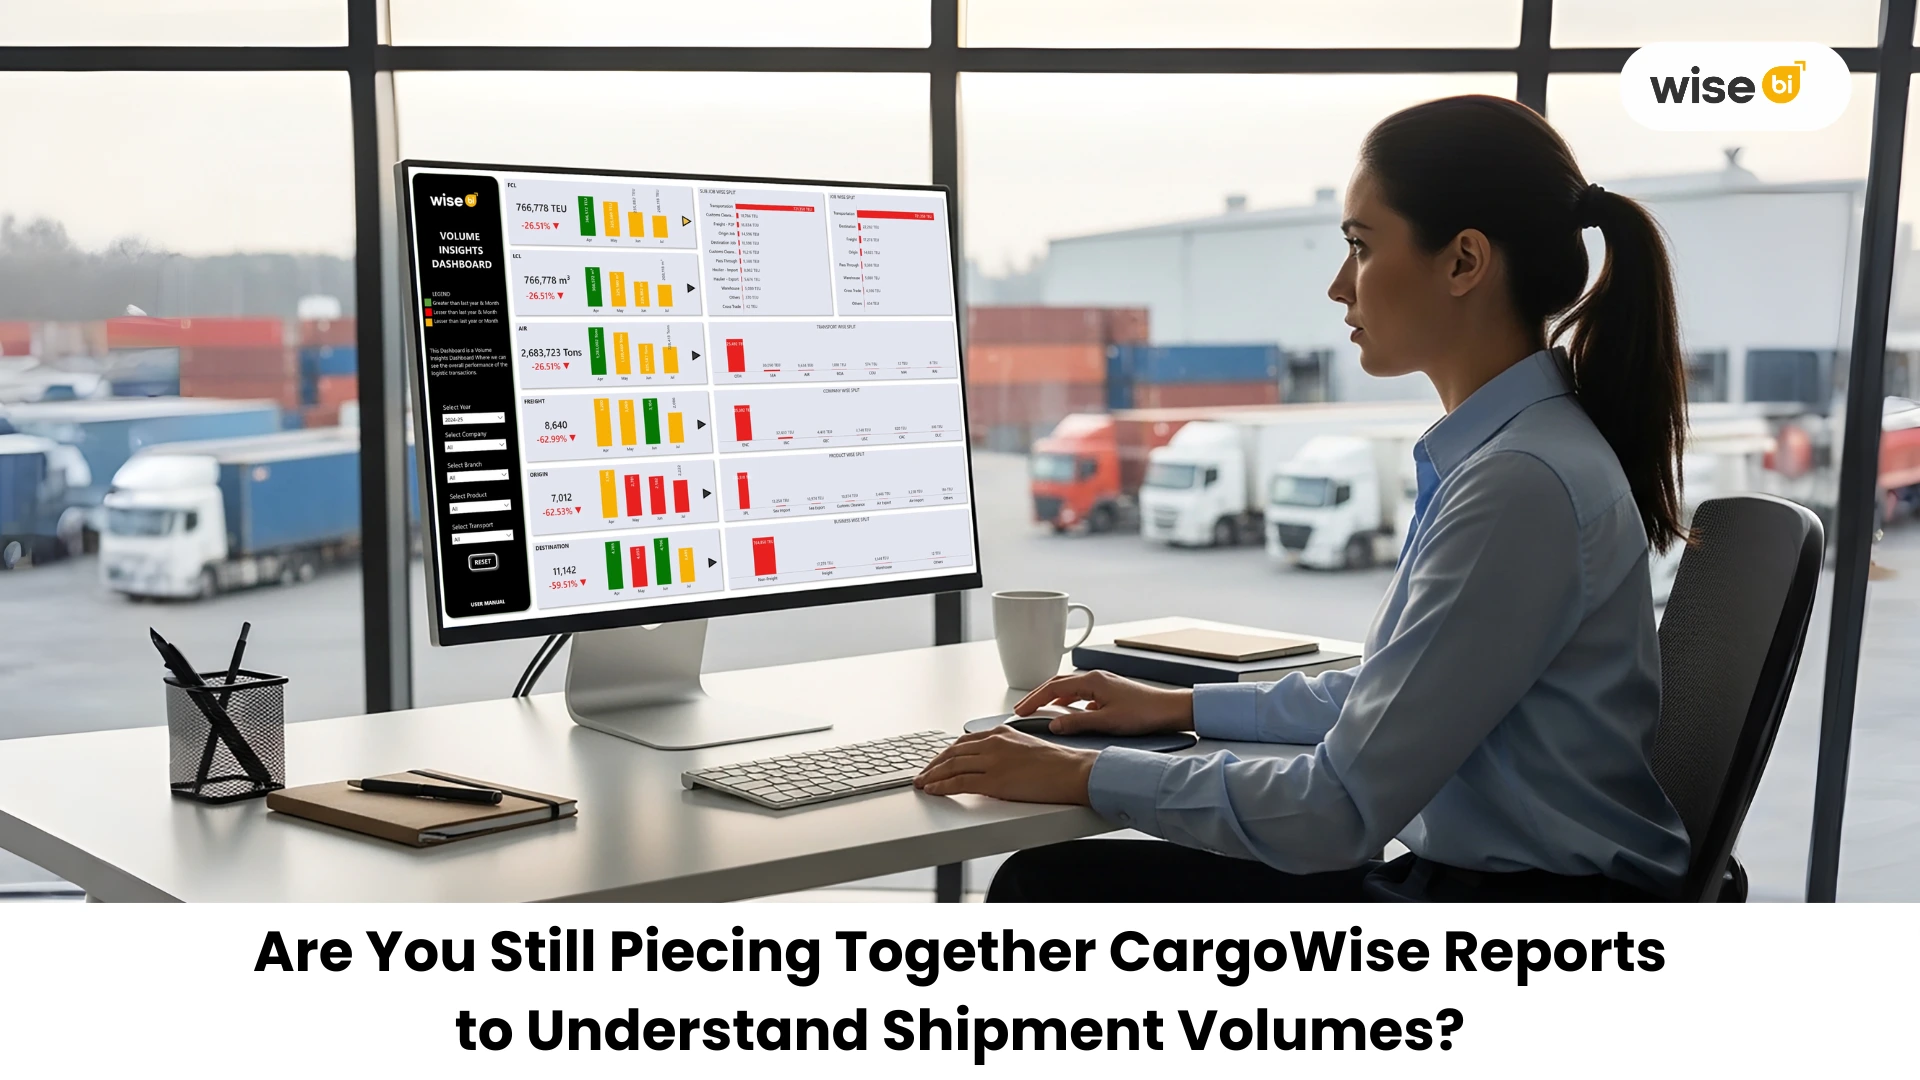
Every day, your team works in CargoWise, creating jobs, managing shipments, and tracking volumes by TEU, tonnage, and cubic measurement. Data is present. There is no doubt about it.
However, when it comes to understanding how your volumes are actually performing, things can become disorganized.
You might look at one report for shipment volume, another for job activity, and yet another for transportation insights. By the time you get everything together, the opportunity to act has passed.
📈 Introducing a Smarter Way to View Your CargoWise Shipments Volumes
The CargoWise Volume Insights Dashboard brings your scattered data into one clear, structured view, so you no longer have to piece things together manually.
Instead of switching between reports, you can now see:
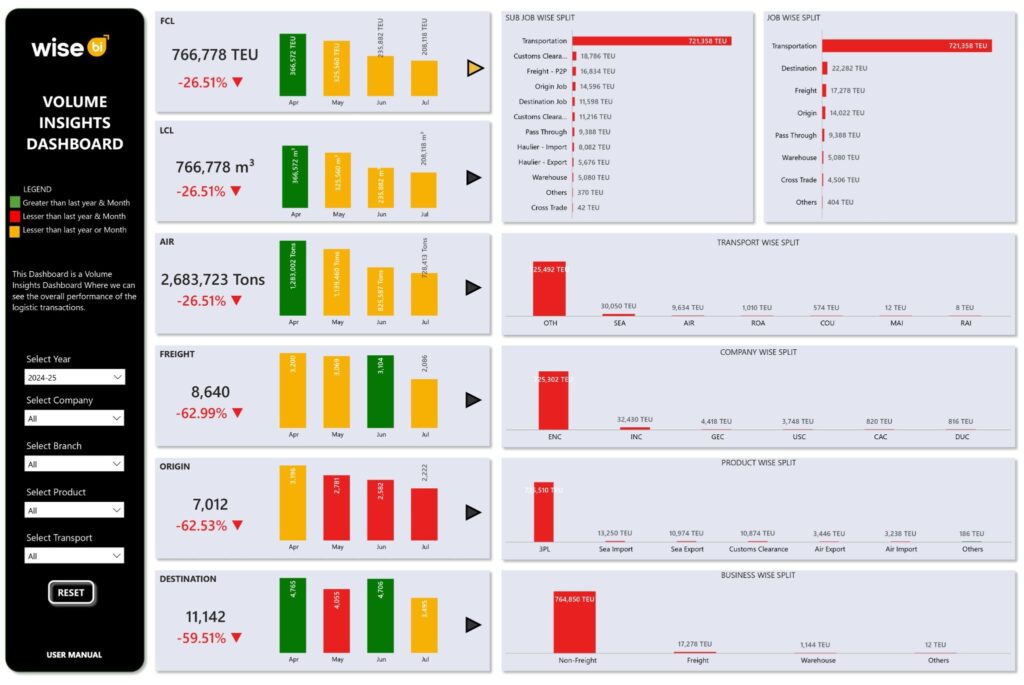
- Volume across TEU, tonnage, and cubic measurements in one place
- Monthly trends that show how your operations are shifting over time
- Job-wise activity across transportation, customs, freight, and warehouse
- Business split between freight and non-freight operations
- Product and service contribution across your CargoWise environment
It’s still your CargoWise data, just presented in a way that’s easier to understand.
🔄 Looking at Your Shipment Volume Data from a Different Angle
Most teams view shipment volume data as a summary to be reviewed later. However, when your data is clearly structured, you begin to see things differently.
Instead of focusing solely on totals, you begin to consider the following:
- Where is the volume coming from?
- Which areas of the operation handle the most activity?
- How do different services and modes of transportation contribute?
- Are the changes gradual or sudden?
This shift in perspective allows you to move from reactive to proactive thinking.
🔍 One View That Brings Everything Together
When your CargoWise data sits across multiple reports, it takes time and effort to understand the full picture. Each report gives you a piece, but not the complete story.
Bringing everything into one view changes that.
You’re able to see how volumes move across months, how different job types contribute, and how transport modes and services shape your operations, all at once.
- No need to switch between multiple reports
- No need to manually connect data points
- No delays in understanding performance
It becomes easier to move from looking at numbers to understanding their meaning.
How does the BI Dashboard Help You with Your Daily Work?
When your CargoWise data is organized into a single, clear view, your daily workflow becomes much more efficient and focused. Instead of wasting time looking for information, your team can work directly from insights.
In practical terms, this means:
- You do not need to pull multiple CargoWise reports to understand volume performance.
- You can immediately answer operational questions during meetings or reviews.
- You detect volume changes early, rather than reacting after the impact.
- Your team remains aligned because everyone is looking at the same data.
- Planning becomes easier with a clear view of trends in jobs, transportation, and services.
It is a simple change, but it has a significant impact on how your team operates on a daily basis. Instead of chasing data, you are already using it with BI dashboards.
🌐 Why does this Shift Matter Right Now?
Logistics operations aren’t slowing down; they’re getting more demanding and dynamic. Customer expectations are higher, shipment timelines are shorter, and even minor delays can spread throughout the supply chain.
It is difficult to keep up in this type of environment when reports are delayed or scattered. By the time you notice a change in volume or performance, the impact on operations or margins has already occurred.
That’s why having a clear, connected view of your CargoWise data is becoming increasingly important, not only for reporting but also for maintaining control over your operations as they evolve.
🧩 The Bigger Picture Most Teams Miss
CargoWise already records everything: every shipment, job, and movement. However, it remains raw information in the absence of a BI dashboard.
Raw information does not help you make a decision faster.
What makes the difference is visibility that connects everything, allowing your team to understand not only what happened but also what it meant.
📢 Final Thoughts
If your team is still using multiple reports to understand CargoWise data, it may be time to simplify how you view your operations.
The logistics BI solution enables you to consolidate your CargoWise data into a single, clear view, allowing your team to move faster, respond faster, and make confident decisions.
Because when CargoWise data starts showing you the whole picture, your operations become more efficient.