

Curated dashboards plus predictive insights that recommend your next move

Insights, playbooks and product thinking from the Wise BI team.

Take Control of Your Logistics Finances with Our Financial Operations Dashboards

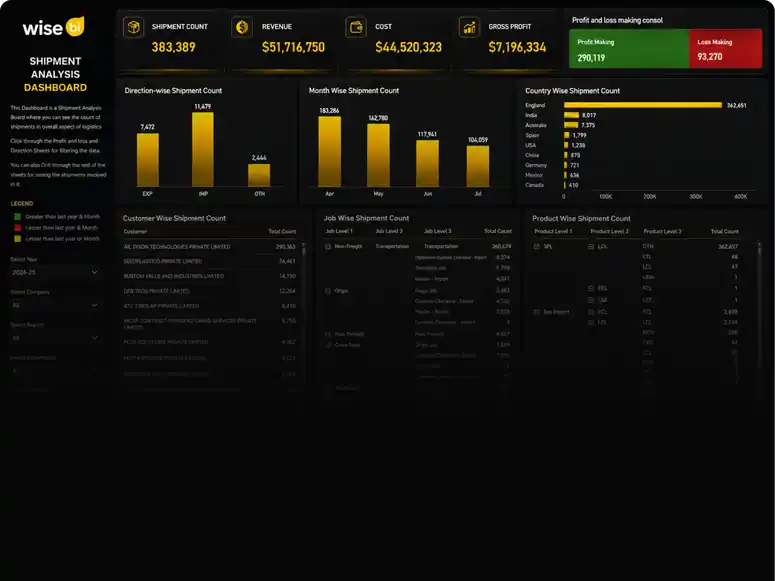
Connect financial data across freight shipments, customers, carriers, suppliers, overseas agents, and branches in a single view of your logistics business. Monitor profitability, receivables, payables, and financial health to improve cash flow and make informed decisions.

Take Control of Your Logistics Finances with Our Financial Operations Dashboards dashboard preview

Our BI Dashboard Capabilities from Financial Performanceto Cash Flow Management

WiseBI provides AI-powered financial operations dashboards that connect balance sheets, profit and loss, receivables, and payables for clearer visibility into financial health, profitability, and cash flow across your logistics business.

01
IFRS Balance Sheet Dashboard preview

IFRS Balance Sheet Dashboard

Review your company's assets, liabilities, and equity through a structured dashboard designed to support IFRS-based financial analysis.

  • Monitor cash, receivables, payables, assets, and liabilities
  • Compare financial positions across countries and entities
  • Review changes across currencies and reporting periods
Explore More
IFRS Profit & Loss Dashboard preview

IFRS Profit & Loss Dashboard

Analyze income, direct costs, operating expenses, and profitability through an IFRS-based reporting view.

  • Compare income, expenses, and profit across periods
  • Review results across branches, countries, and entities
  • Identify cost increases and declining profitability
Explore More
Balance Sheet Dashboard preview

Balance Sheet Dashboard

Understand what your logistics business owns, owes, and retains by bringing key financial information into one accessible view.

  • Monitor assets, liabilities, and shareholder equity
  • Review customer receivables and supplier payables
  • Compare financial positions across branches and periods
Explore More
Profit & Loss Dashboard preview

Profit & Loss Dashboard

See how revenue, direct shipment costs, overheads, and other expenses affect your company's overall profitability.

  • Track income, direct costs, expenses, and net profit
  • Compare financial results across business areas
  • Identify where rising costs are weakening margins
Explore More
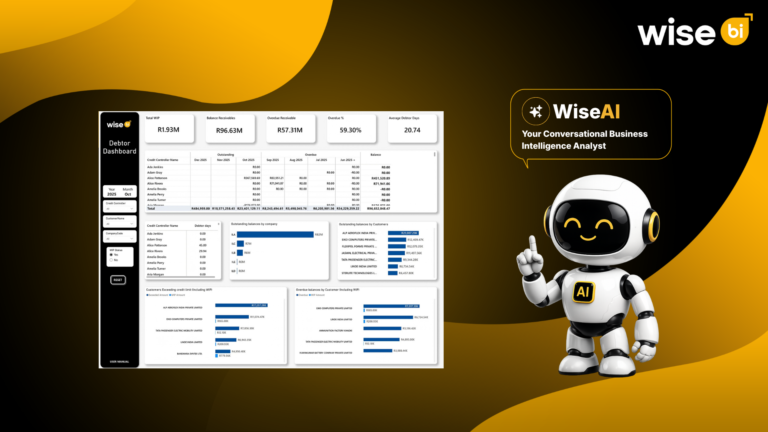
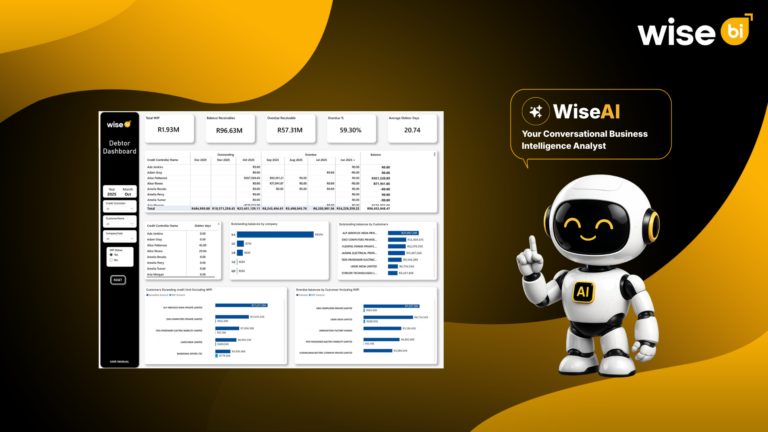
Debtor Dashboard preview

Debtor Dashboard

Monitor outstanding customer balances and payment aging to understand where working capital is tied up and which accounts require collection attention.

  • Track outstanding receivables by customer
  • Review current and overdue balances by aging period
  • Prioritize accounts requiring payment follow-up
Explore More
Creditor Dashboard preview

Creditor Dashboard

Monitor amounts owed to carriers, overseas agents, and other suppliers to plan payments and manage financial obligations more effectively.

  • Review outstanding supplier balances
  • Track upcoming and overdue payment obligations
  • Analyze payables by supplier and aging period
Explore More

Benefits of Our Financial Operations Dashboards

Understand Your Financial Position

See how assets, liabilities, equity, freight income, operating expenses, receivables, and payables shape the financial health of your logistics business.

Monitor Your Logistics Profitability

Compare shipment revenue with carrier costs, overseas agent charges, and operating expenses to identify what is strengthening or reducing your profit.

Gain Better Receivables Control

Track outstanding freight invoices, review customer aging balances, and help your collection team prioritize overdue shipper accounts.

Plan Supplier Payments Effectively

Monitor amounts owed to carriers, overseas agents, customs service providers, and other logistics suppliers so your finance team can plan payments effectively.

Compare Your Global Performance

Analyze financial results across logistics companies, countries, branches, currencies, customers, carriers, and reporting periods.

Plan Your Cash Flow More Clearly

Compare incoming customer payments with outgoing carrier, agent, and supplier obligations to understand your short-term cash requirements.

Frequently Asked Questions

You can monitor assets, liabilities, equity, income, expenses, profitability, customer receivables, supplier payables, and aging balances. Results can also be compared across companies, countries, branches, currencies, customers, suppliers, and reporting periods.

The dashboards organize transactions involving shipments, customers, carriers, overseas agents, suppliers, and branches. This helps your finance team monitor financial health, understand profitability, follow up on outstanding payments, and manage supplier obligations.

The Debtor Dashboard shows outstanding customer balances and aging periods in an interactive view. Your finance team can identify overdue invoices, prioritize collection activity, and understand which accounts are affecting working capital.

WiseBI combines pre-built logistics dashboards, customizable financial reporting, and conversational BI. It helps finance teams analyze company performance, receivables, and payables while reducing reliance on disconnected reports and time-consuming spreadsheet consolidation.

Ready to Gain a Clearer View of Your Logistics Financial Performance?

Schedule a Call