


Revenue
Measure the revenue generated by each customer account.

Curated dashboards plus predictive insights that recommend your next move
Insights, playbooks and product thinking from the Wise BI team.

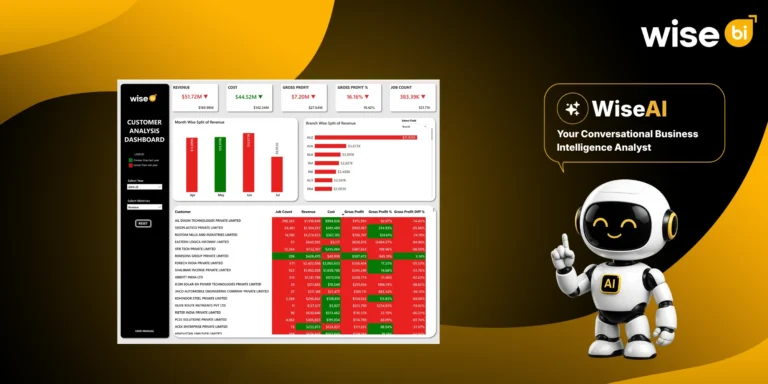
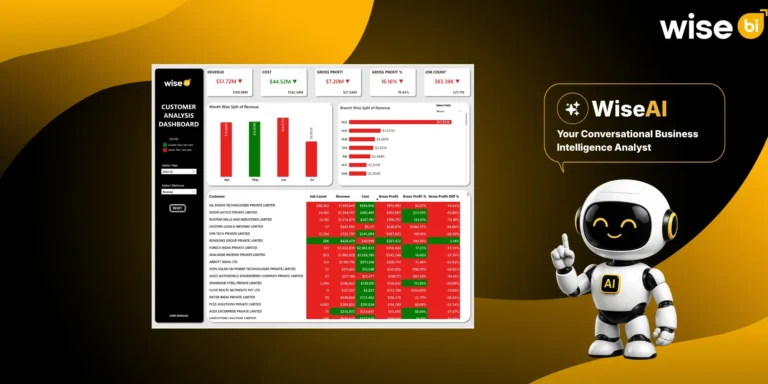
Analyze customer value across revenue, cost, profitability, workload, and performance trends in one connected view.


The Problem
Customer information is often reviewed through separate operational and financial reports, making it difficult to understand which accounts create sustainable business value.

High customer revenue does not always result in strong gross profit or healthy margins.

The cost of serving each customer is difficult to assess when financial and job data remain disconnected.

Improving and declining customer profitability can remain hidden without a year-over-year comparison.

Customer job count is rarely evaluated alongside revenue, cost, and profitability.
Solution: Connected customer insight for stronger decisions.
Capability Overview
The Customer Analysis Dashboard brings customer financial results, operational workload, monthly movement, and branch contribution into one executive workspace. Instead of measuring accounts by revenue alone, leadership gains real-time customer intelligence to evaluate profitability, compare operational demand, identify changing margins, and prioritize the relationships that deserve commercial attention.


Understand the complete financial value of each customer.
 Compare revenue and costReview gross profitEvaluate GP%

Identify which customer accounts contribute the strongest results.
Rank customer performanceCompare financial outcomesReview customer contribution

See how account performance changes over time.
Monitor the gross profit differenceCompare against previous-year resultsReview monthly revenue movement

Measure the workload supporting each customer relationship.
Track job countCompare account activityReview branch-wise revenue contributionMetric Index
Track customer financial and operational performance from company summary to individual account records.
Revenue
Measure the revenue generated by each customer account.
Cost
Review the cost associated with serving each customer.
Gross Profit
Identify the financial contribution generated after costs.
Profitability Performance
Monitor GP% and track profitability improvements or declines over time.
Job Count
Measure the operational activity associated with each customer.
Revenue Distribution
Track monthly revenue movement and compare revenue contribution across branches.
Who Benefits from this Dashboard?

Understand which customers create the greatest long-term business value.

Identify growth opportunities and strengthen customer portfolio strategies.

Monitor customer profitability, margins, and financial performance.

Review customer performance and prioritize high-value relationships.
Our Customer Analysis Dashboard connects financial performance, operational activity, profitability trends, and customer contribution into one executive view. Instead of relying solely on revenue, leadership gains real-time customer intelligence to evaluate account performance, identify commercial opportunities, and strengthen long-term profitability.
Key Outcomes:
 Compare revenue, cost, gross profit, and GP%.Monitor customer profitability changes over time.Identify your highest-value customer accounts.Review customer workload through job count.Compare branch-wise customer contribution.Track monthly revenue performance.Evaluate customer performance against previous periods.Use WiseAI to uncover customer trends and commercial opportunities faster.

"Every customer insight helps build a stronger, more profitable customer portfolio."
Tracks customer profitability changes alongside revenue trends.Connects customer revenue, costs, profitability, and operational activity in one executive dashboard.Interactive analysis by customer, branch, metric, month, and reporting year.Compares financial and operational performance from a single workspace.Pre-mapped with CargoWise customer data to eliminate manual report consolidation.Visual customer ranking for faster commercial decision-making.Supports customer portfolio optimization through connected insights.WiseAI enables natural-language customer intelligence.Blogs, newsletters and case studies on CargoWise Customer Analysis Dashboard.
 Blog
Blog
CargoWise gives freight forwarders access to a large amount of customer, shipment, job, revenue, cost, and operational data. But customer analysis becomes much more…
 Blog
Blog
Revenue does not tell you which customers are truly valuable A customer may generate strong revenue and still deliver a weak return. For freight…
 Blog
Blog
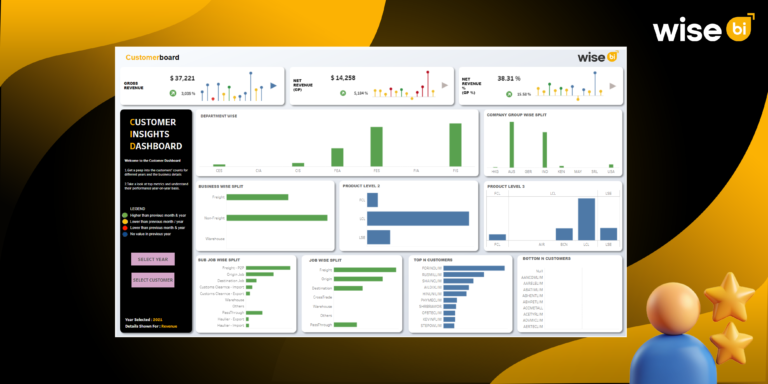
Consider having a dashboard that acts as a command center for comprehending all aspects of your consumer base. For logistics organizations using CargoWise, the…
Compare revenue, cost, gross profit, and profitability to identify the customers contributing the most value to your business.
Track profitability changes, margins, and operational workload to identify accounts that may require pricing reviews, service optimization, or account management.
Yes. Review branch-wise revenue contribution alongside customer financial performance to understand how accounts perform across your network.
Analyze monthly revenue trends and profitability changes to identify improving or declining customer performance across reporting periods.
WiseAI lets you ask natural-language questions, uncover customer trends, investigate profitability changes, and identify opportunities to grow your most valuable customer accounts.