


CargoWise gives freight forwarders access to a large amount of customer, shipment, job, revenue, cost, and operational data. But customer analysis becomes much more useful when that data is organized around the specific questions commercial, finance, sales, and management teams need to answer.
A single CargoWise report cannot display everything.
Management may want to know which customers generate the highest profit. Sales teams may want to know if newly acquired customers are converting into valuable accounts. Account managers may need to identify customers whose activity is declining, whereas executives may want to understand long-term customer value over multiple years and logistics services.
That is why customer analytics works better when different dashboards serve different purposes. For CargoWise users, WiseBI’s CargoWise customer analysis dashboards can provide a more complete view of customer performance, customer behavior, and customer value.
1. Customer Analysis Dashboard
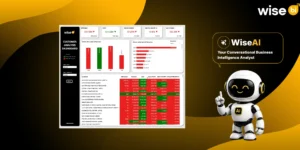
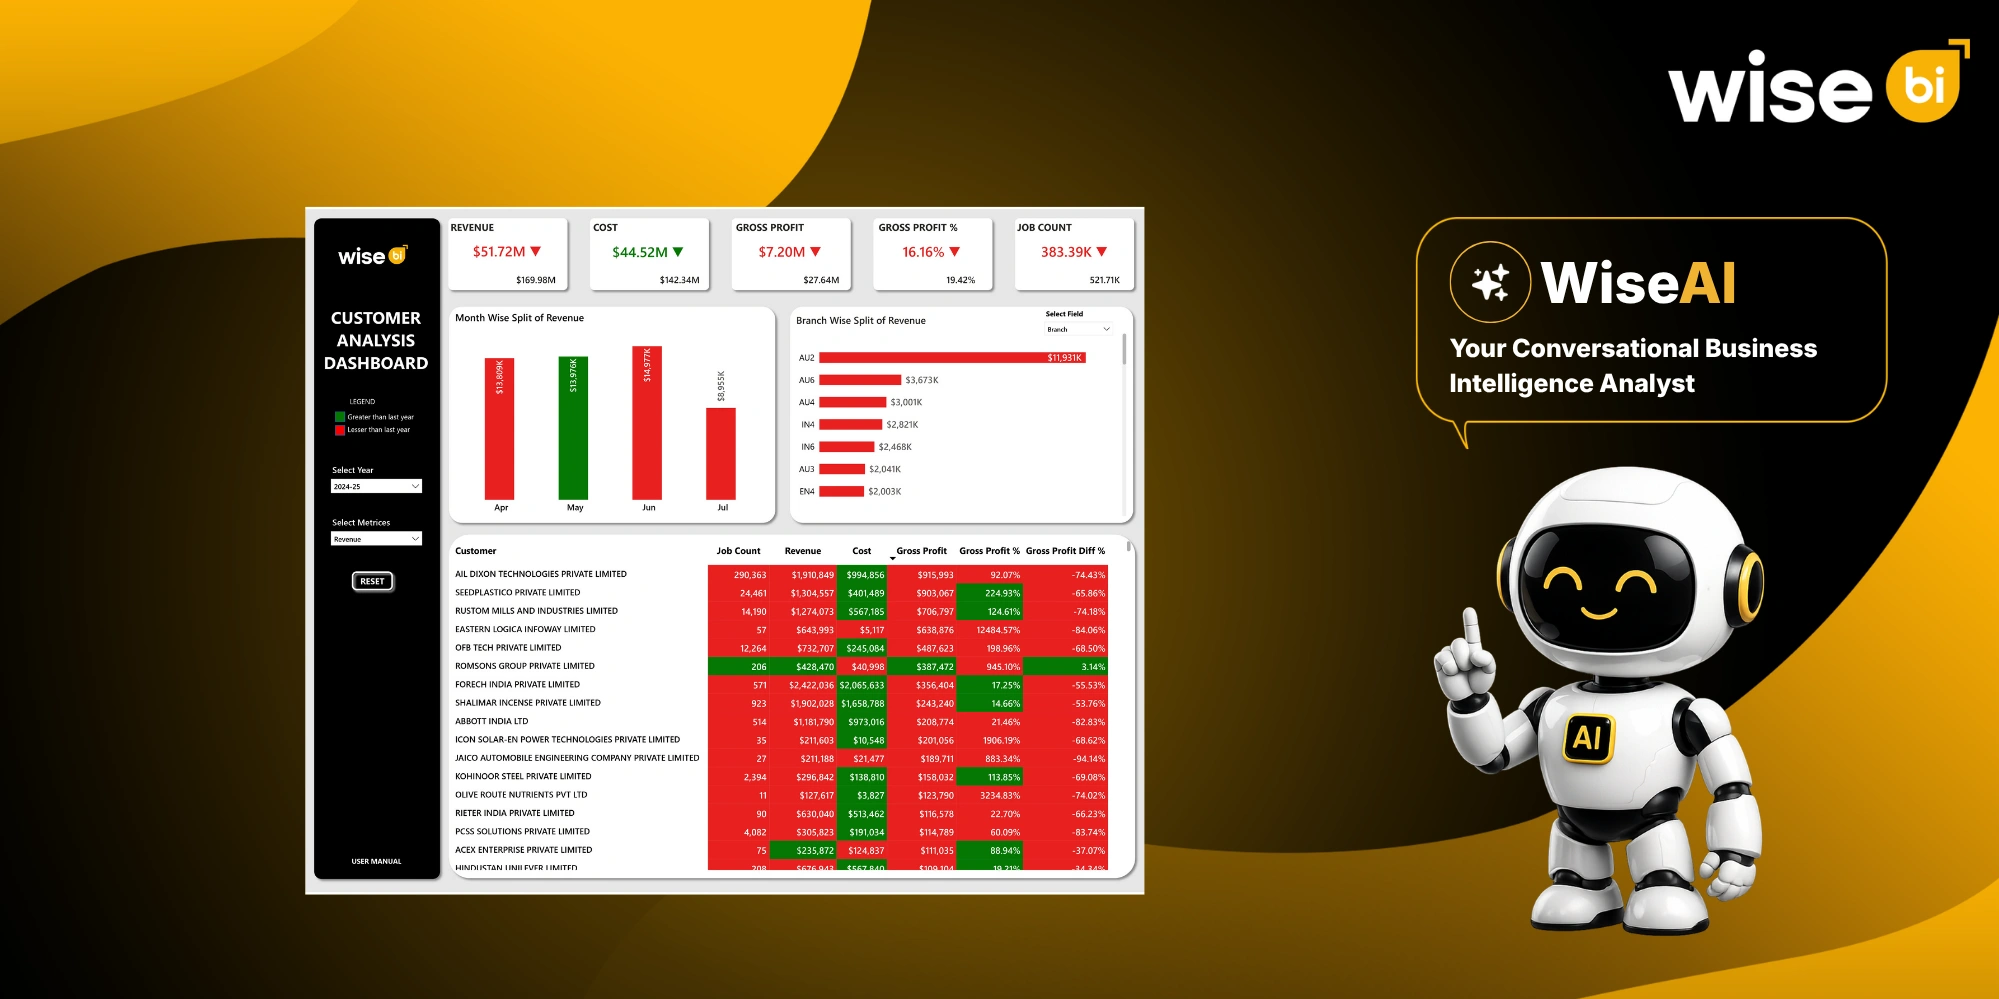
The CargoWise Customer Analysis dashboard gives management a broad financial and operational view of customer performance. It brings together key measures, including revenue, cost, gross profit, gross profit percentage, and job count. It also shows month-wise revenue trends, branch-wise revenue contribution, and individual customer performance, including changes in gross profit percentage.
For freight forwarders, this helps answer an important commercial question: Which customers generate revenue, and which customers actually contribute profit?
Revenue alone can give an incomplete picture of customer value. A high-revenue account may also carry high costs or weaker margins. By reviewing revenue, cost, gross profit, gross profit percentage, and job count together, management can better understand whether customer activity is translating into profitable business.
It helps teams:
- Track customer revenue, cost, gross profit, and gross profit percentage
- Review job count alongside financial performance
- Monitor month-wise revenue trends
- Compare branch-wise revenue contribution
- Evaluate individual customer profitability
- Identify accounts with improving or declining gross profit performance
- Understand whether high-revenue customers are also delivering strong commercial value
- Support customer portfolio reviews, profitability analysis, and account prioritization
The branch-wise split also helps leadership understand where customer revenue is being generated across the network. At the same time, the customer-level view makes it easier to identify accounts whose profitability is improving or declining.
This dashboard is particularly useful for customer portfolio reviews, profitability analysis, branch-level commercial discussions, pricing reviews, and account prioritization. It gives freight forwarding teams a clearer view of which customer relationships are contributing profitable business and where management may need to take a closer look at costs, margins, or overall account performance.
2. Per Customer Analysis Dashboard
The CargoWise Per Customer Analysis Dashboard helps freight forwarders compare the average financial and operational contribution of customers across different segments.
It helps teams:
- Track total customer count across SME, corporate, and unclassified segments
- Compare average gross profit per customer
- Identify profit-making and loss-making customers
- Analyze FCL TEU, LCL CBM, and air freight tonnage per customer
- Review freight count, origin count, and destination count
- Compare customer segments based on both profitability and freight activity
- Understand whether higher shipment activity is translating into stronger profit
- Support customer segmentation, pricing reviews, and portfolio planning
This gives management a clearer view of how different customer groups contribute to the business and helps teams balance freight volume with actual commercial value.
3. Customer Insights Dashboard
The CargoWise Customer Insights Dashboard helps freight forwarders understand where customer revenue and gross profit are actually coming from across the business.
It helps teams:
- Track revenue, gross profit, and gross profit percentage
- Review month-wise customer performance
- Analyze customer activity by transport mode
- Compare contribution across business areas and companies
- Understand performance by product, job type, and sub-job type
- See whether revenue is concentrated in sea freight, air freight, customs, warehousing, transportation, or other services
- Identify which logistics services contribute most to customer value
- Find opportunities to expand customer relationships across additional service areas
This gives commercial teams a clearer view of what is driving customer revenue and profitability and where there may be opportunities to grow account value.
4. Customer Attrition Dashboard
Customer loss typically occurs gradually as shipment activity or revenue declines over time. The CargoWise Customer Attrition Dashboard assists freight forwarders in identifying these changes and determining which customer relationships may require attention.
It helps teams:
- Track customer count and revenue by month
- Review each customer’s first and last purchase periods
- Understand total relationship duration and active months
- Compare customer revenue, cost, profit, and profit percentage
- Group customers based on how long they remain active
- Identify accounts showing reduced or discontinued activity
- Prioritize customers that may require retention follow-up
- Support more focused account-management decisions
This gives commercial and account-management teams clearer visibility into customer retention patterns and helps them act on weakening relationships before valuable business is lost.
5. New-Customer Insights Dashboard
Winning a new customer is only the beginning. The CargoWise New-Customer Insights Dashboard helps freight forwarders understand whether recently acquired accounts are developing into commercially valuable businesses.
It helps teams:
- Track new-customer revenue, cost, gross profit, and gross profit percentage
- Monitor the number of newly acquired customers
- Review month-wise customer performance
- Understand which jobs and products are generating revenue
- Compare the performance of new customer accounts
- Identify which new customers are becoming stronger contributors
- Spot accounts that may need further development
- Support sales reviews, onboarding, and account-growth planning
This gives sales and management teams a clearer view of whether new customer wins are turning into profitable, sustainable business rather than simply increasing customer count.
6. Customer LTV Dashboard
Some customer relationships create value over several years, not just within a single reporting period. The CargoWise Customer LTV Dashboard gives freight forwarders a longer-term view of customer contribution by bringing together historical revenue, relationship duration, and service-level activity.
It helps teams:
- Track customer revenue across multiple financial years
- Understand how long customer relationships remain active
- Review customer contribution across freight and non-freight services
- Analyze activity across different job and service categories
- Identify customers delivering consistent long-term value
- Support account management and customer retention priorities
- Understand whether customer value comes from multiple services or a limited service mix
This gives leadership a clearer view of which customer relationships create sustained value and where commercial teams should focus their long-term account-development efforts.
Why are Customer Dashboards Important for Freight Forwarders?
Customer data is one of the most valuable parts of a freight forwarding business, but looking only at revenue or shipment volume can give an incomplete picture. These six CargoWise customer dashboards bring together the different aspects of customer performance that matter commercially and help teams understand the full customer lifecycle.
They can help freight forwarders:
- Identify which customers are profitable and which may be weakening
- Understand how active each account is and which services they use
- Track whether customer activity is growing or declining
- Evaluate how new customers are developing after acquisition
- Prioritize customer retention and account-management efforts
- Support pricing and profitability reviews
- Identify cross-service and account-growth opportunities
- Understand long-term customer value
By using these dashboards together, commercial, sales, finance, and management teams can move beyond isolated customer reports and make more informed decisions about which customer relationships need attention and what action to take next.
How do the Six Dashboards Work Together?
These BI dashboards should not be treated as six versions of the same customer report. Each one supports a different customer-management need.
| BI Dashboard | What it Helps You Understand |
| Customer Analysis Dashboard | Overall customer revenue, cost, gross profit, job activity, and branch contribution |
| Per Customer Analysis Dashboard | Average customer value, customer segmentation, profitability, and freight activity |
| Customer Insights Dashboard | Where do customer revenue and profit come from across services, products, jobs, and transport modes? |
| Customer Attrition Dashboard | How does customer activity change over time, and which relationships may be weakening? |
| New-Customer Insights Dashboard | How are recently acquired customers performing after acquisition? |
| Customer LTV Dashboard | How does customer value develop across years and logistics services? |
Together, they provide a more complete customer analytics framework for CargoWise users. This is far more useful than relying only on customer revenue rankings or manually prepared spreadsheets.
Conclusion
CargoWise already contains valuable customer, shipment, job, revenue, cost, and profitability data. The challenge is turning that information into a clear customer view that commercial, finance, sales, and management teams can use with confidence.
The Customer Analysis, Per Customer Analysis, Customer Insights, Customer Attrition, New-Customer Insights, and Customer LTV dashboards each answer a different customer-management question. Together, they help freight forwarders understand customer performance, behavior, retention, new-account development, and long-term value.
For CargoWise users, this means customer decisions do not have to rely only on revenue rankings, spreadsheets, or manually prepared reports. Teams can gain a clearer picture of which customers are profitable, how relationships are changing, which services customers use, and where commercial attention is needed.
Want to see how these insights can work with your CargoWise data? Book a free demo with WiseBI and explore how customer analytics can support smarter customer, retention, and commercial decisions.