


Your CargoWise data may show growth, but is that growth actually profitable?
Freight forwarders already generate valuable data across shipments, customers, volumes, revenue, costs, and gross profit. The challenge is turning those numbers into clear business insights.
More shipments can still mean weaker margins. High-revenue customers may deliver low profit. Growing trade lanes may not always generate better returns.
CargoWise BI Solution helps connect operational and financial performance, making it easier to see what is working, where margins are under pressure, and where attention is needed.
Connecting Revenue Growth With Actual Shipment Job Profitability
Revenue growth does not always mean stronger profitability. A freight forwarder may handle more jobs and higher volumes while rising costs quietly reduce margins.
The CargoWise shipment analysis dashboard can bring together measures such as:
- Revenue
- Cost
- Gross profit
- Gross profit percentage
- Job count
- Shipment volume
- Customer contribution
- Branch contribution
This makes it easier to compare operational activity with financial outcomes.
For freight forwarders, this helps shift the focus from how much business is moving to how much profitable business is moving.
Identifying High-Value Customers and Margin-Draining Accounts
Not every high-revenue customer is a high-value customer.
Some accounts generate strong revenue but also create high operational costs, lower margins, or significant workload. Others may generate less revenue but produce stronger gross profit and more consistent business.
CargoWiseCustomer analysis dashboards can help teams compare:
- Customer revenue
- Customer cost
- Gross profit
- Gross profit percentage
- Job activity
- Freight volume
- Service usage
- Account contribution
This gives commercial teams a clearer understanding of customer value and helps identify accounts that may need pricing, cost, or service reviews.
Detecting Early Signs of Customer Decline
Customer loss often happens gradually.
A customer may begin shipping less frequently, reduce volume, stop using a certain service, or generate less revenue over time. If these changes are not noticed early, the relationship may become inactive before the account team reacts.
The CargoWise customer attrition dashboard can help freight forwarders monitor:
- Customer activity over time
- Monthly revenue movement
- Active months
- First and last purchase periods
- Shipment frequency
- Customer profitability
- Service usage
This helps teams see whether an account is stable, growing, or weakening.
The value is not in predicting exactly when a customer will leave. It is in giving account managers better visibility into changes that may deserve attention.
Comparing Trade Lane Volume With Profitability
Trade lanes are a major part of freight forwarding performance.
A lane can grow quickly in shipment count or freight volume and still become less profitable if costs rise faster than revenue. This is why trade-lane analysis should go beyond activity alone.
The CargoWise Trade lane dashboards can help compare performance using:
- Origin
- Destination
- Shipment count
- Freight volume
- Revenue
- Cost
- Gross profit
- Gross profit percentage
- Customer contribution
- Transport mode
This makes it easier to identify where volume growth is commercially valuable and where margin pressure may be developing. It can also support pricing reviews, sales planning, and trade-lane strategy.
Evaluating Branch and Department Contribution
As freight forwarding businesses expand, it becomes harder to compare performance across branches, countries, departments, and teams.
One branch may produce high revenue but lower margins. Another may process fewer jobs while generating stronger gross profit.
Without a consistent reporting view, these differences can be difficult to understand.
The CargoWise branch insights dashboard can help management compare:
- Revenue by branch
- Cost by branch
- Gross profit
- Job count
- Shipment volume
- Customer contribution
- Department performance
- Operational workload
This gives leadership a clearer picture of which areas are contributing most effectively to business performance.
Instead of treating all branches or departments as if they perform in the same way, management can use the data to make more informed decisions about resources, targets, and performance reviews.
Tracking Volume Changes Across FCL, LCL, and Air Freight
Freight volume does not move evenly across every transport mode.
FCL activity may increase while LCL declines. Air freight volume may grow in one customer segment and fall in another. Certain origins or destinations may also become more active over time.
Without a structured view, these changes can be difficult to spot.
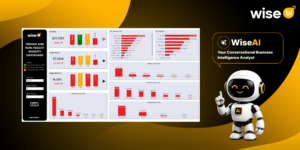
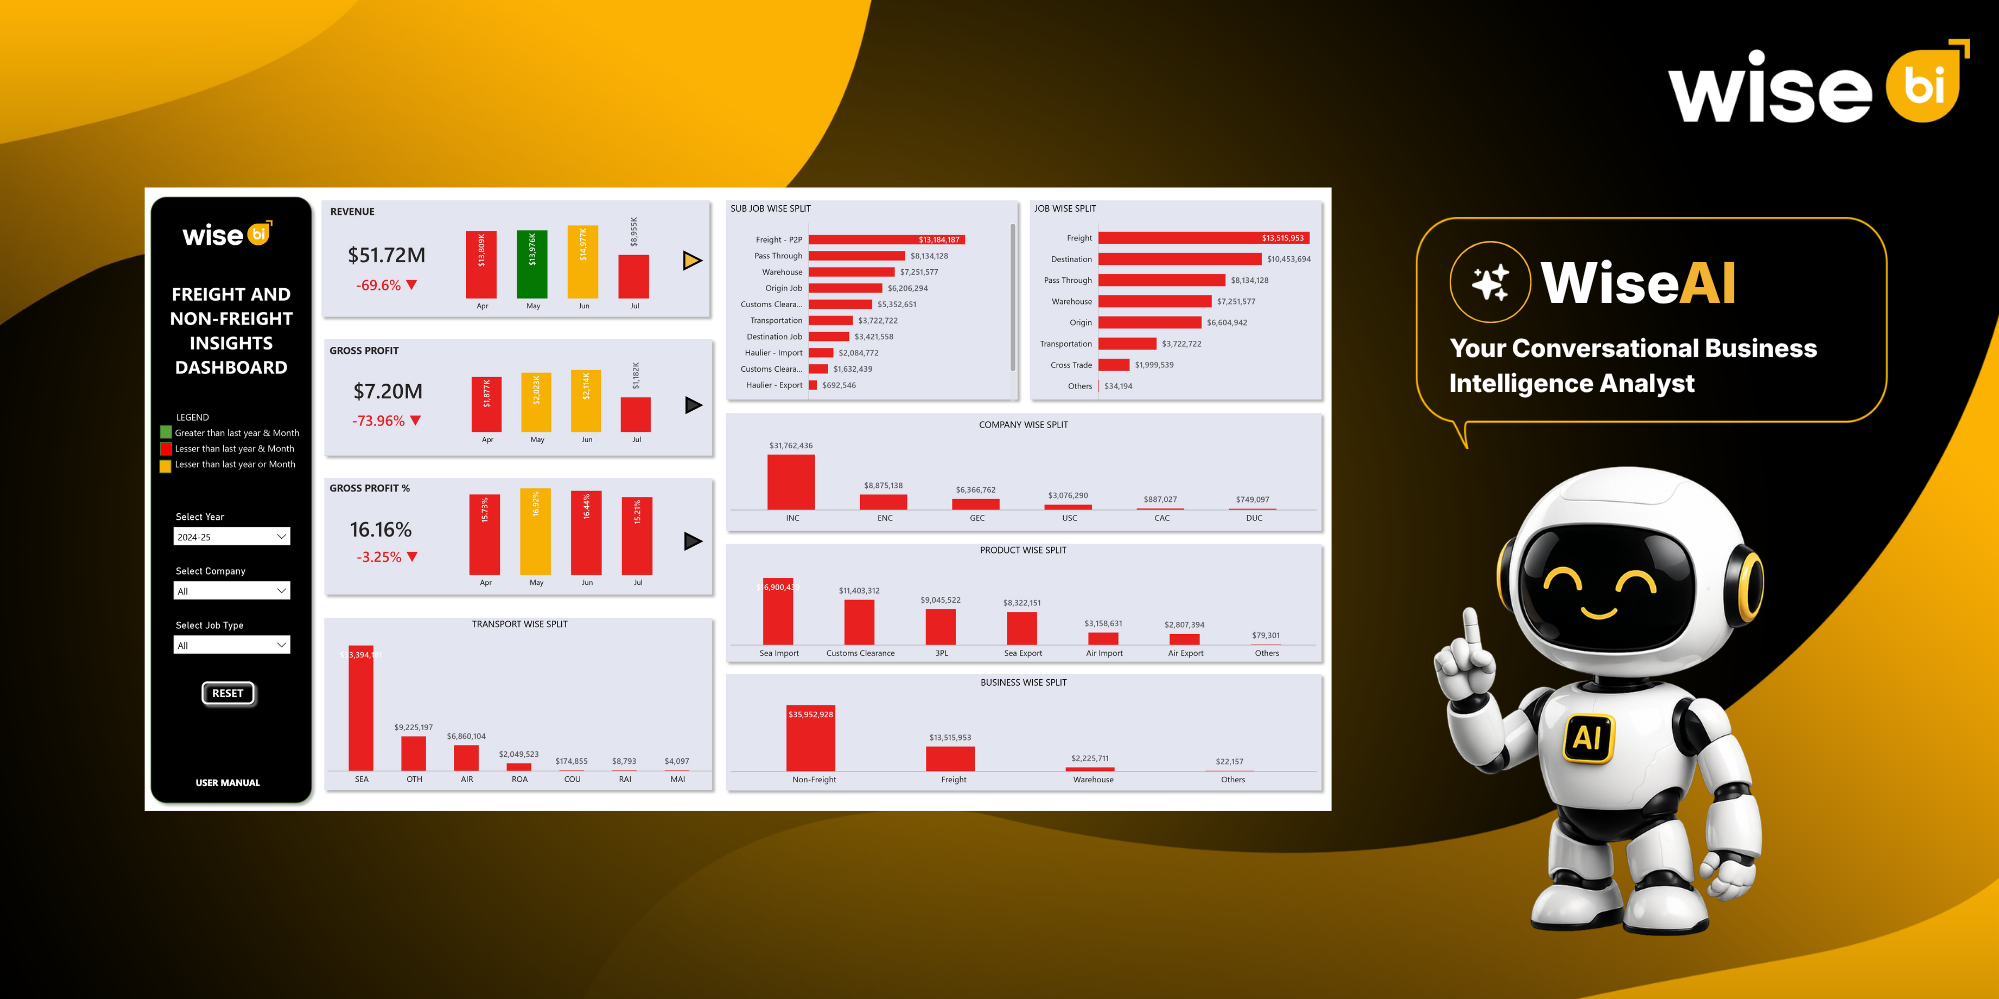
The CargoWise Freight & Non-Freight Insights Dashboard can help freight forwarders analyze:
- FCL TEU
- LCL CBM
- Air freight tonnage
- Shipment count
- Customer activity
- Origin and destination
- Revenue and gross profit
- Period-to-period volume movement
This helps operations and commercial teams understand where freight demand is changing.
The value is not simply knowing whether total volume increased or decreased. It is understanding which freight activity is changing and whether that change is commercially valuable.
Connecting Shipment Activity With Gross Profit Performance
Higher shipment counts do not always result in higher gross profit.
A business may process more jobs while margins remain flat because certain customers, services, or routes carry higher costs or weaker pricing.
A BI dashboard can help compare shipment count with:
- Revenue
- Cost
- Gross profit
- Gross profit percentage
- Customer
- Branch
- Service type
- Transport mode
This gives management a clearer way to understand the relationship between workload and profitability.
For freight forwarders, the important point is that operational activity and financial performance should be reviewed together.
Reducing Manual CargoWise Reporting Work
Manual reporting can consume valuable time.
Teams may export CargoWise data, clean files, check formulas, prepare charts, and rebuild similar reports every week or month.
CargoWise BI dashboards can reduce dependence on repeated manual reporting by presenting data in structured, reusable views.
This allows teams to spend less time preparing reports and more time analyzing performance. It can also improve consistency by reducing reliance on multiple spreadsheet versions across departments.
Giving Management a Clearer View Across the Business
Senior management needs to understand performance across shipments, customers, revenue, gross profit, trade lanes, branches, departments, and operational activity.
When this information is spread across several reports, it becomes harder to see the bigger picture.
CargoWise BI dashboards can provide focused management views that bring these areas together, helping leadership see where performance is improving and where deeper investigation may be needed.
The goal is not to replace every operational report with one dashboard. It is to give leadership a clearer starting point for understanding overall business performance.
Connecting Operational and Financial Performance With CargoWise BI Dashboards
The real value of BI is not simply having more dashboards. It comes from connecting operational activity with financial performance.
Shipment activity can be viewed alongside revenue and gross profit. Customer performance can be compared with freight volume and service usage. Trade-lane growth can be reviewed alongside margins. Branch workload can be compared with commercial contribution.
This helps freight forwarders connect:
Shipment activity → Customer performance → Revenue → Cost → Gross profit → Business performance
That connection matters because many freight forwarding problems are linked.
A decline in customer activity can affect shipment volume. Lower shipment volume can affect revenue. Higher costs can reduce gross profit even when revenue remains strong.
By connecting these areas, CargoWise BI dashboards can help teams understand not only what changed but also where they should look next.
Why do Freight Forwarders Need More than Standard Reporting?
CargoWise contains valuable data across many parts of the freight forwarding business. But the value of that data increases when teams can analyze it around specific business questions.
Operations teams may need shipment and volume analysis. Commercial teams may focus on customer and trade-lane performance. Finance teams may need profitability and cost visibility. Leadership may need a wider view across the organization.
That is why one general report is rarely enough.
A broader CargoWise BI dashboard library gives different teams access to focused views while keeping reporting connected to the same business data.
This makes it easier to move from a high-level result to the operational or financial detail behind it.
Conclusion
CargoWise already contains valuable shipment, customer, operational, and financial data. The challenge is turning that data into clear business insights.
CargoWise BI dashboards can help freight forwarders identify low-margin jobs, understand customer value, monitor changing account activity, analyze trade lanes, compare branch performance, track freight volume, and reduce manual reporting.
Want to see how your CargoWise data can support better business decisions? Book a free demo with WiseBI and explore how CargoWise BI dashboards can improve visibility, profitability, and performance analysis.