High shipment volume can look like business growth, but it doesn’t always tell the full story. A freight forwarder may be moving shipments every day, serving multiple customers, and managing different trade lanes, yet still face hidden losses, weak margins, or unclear performance trends.
That’s where shipment analysis becomes important.
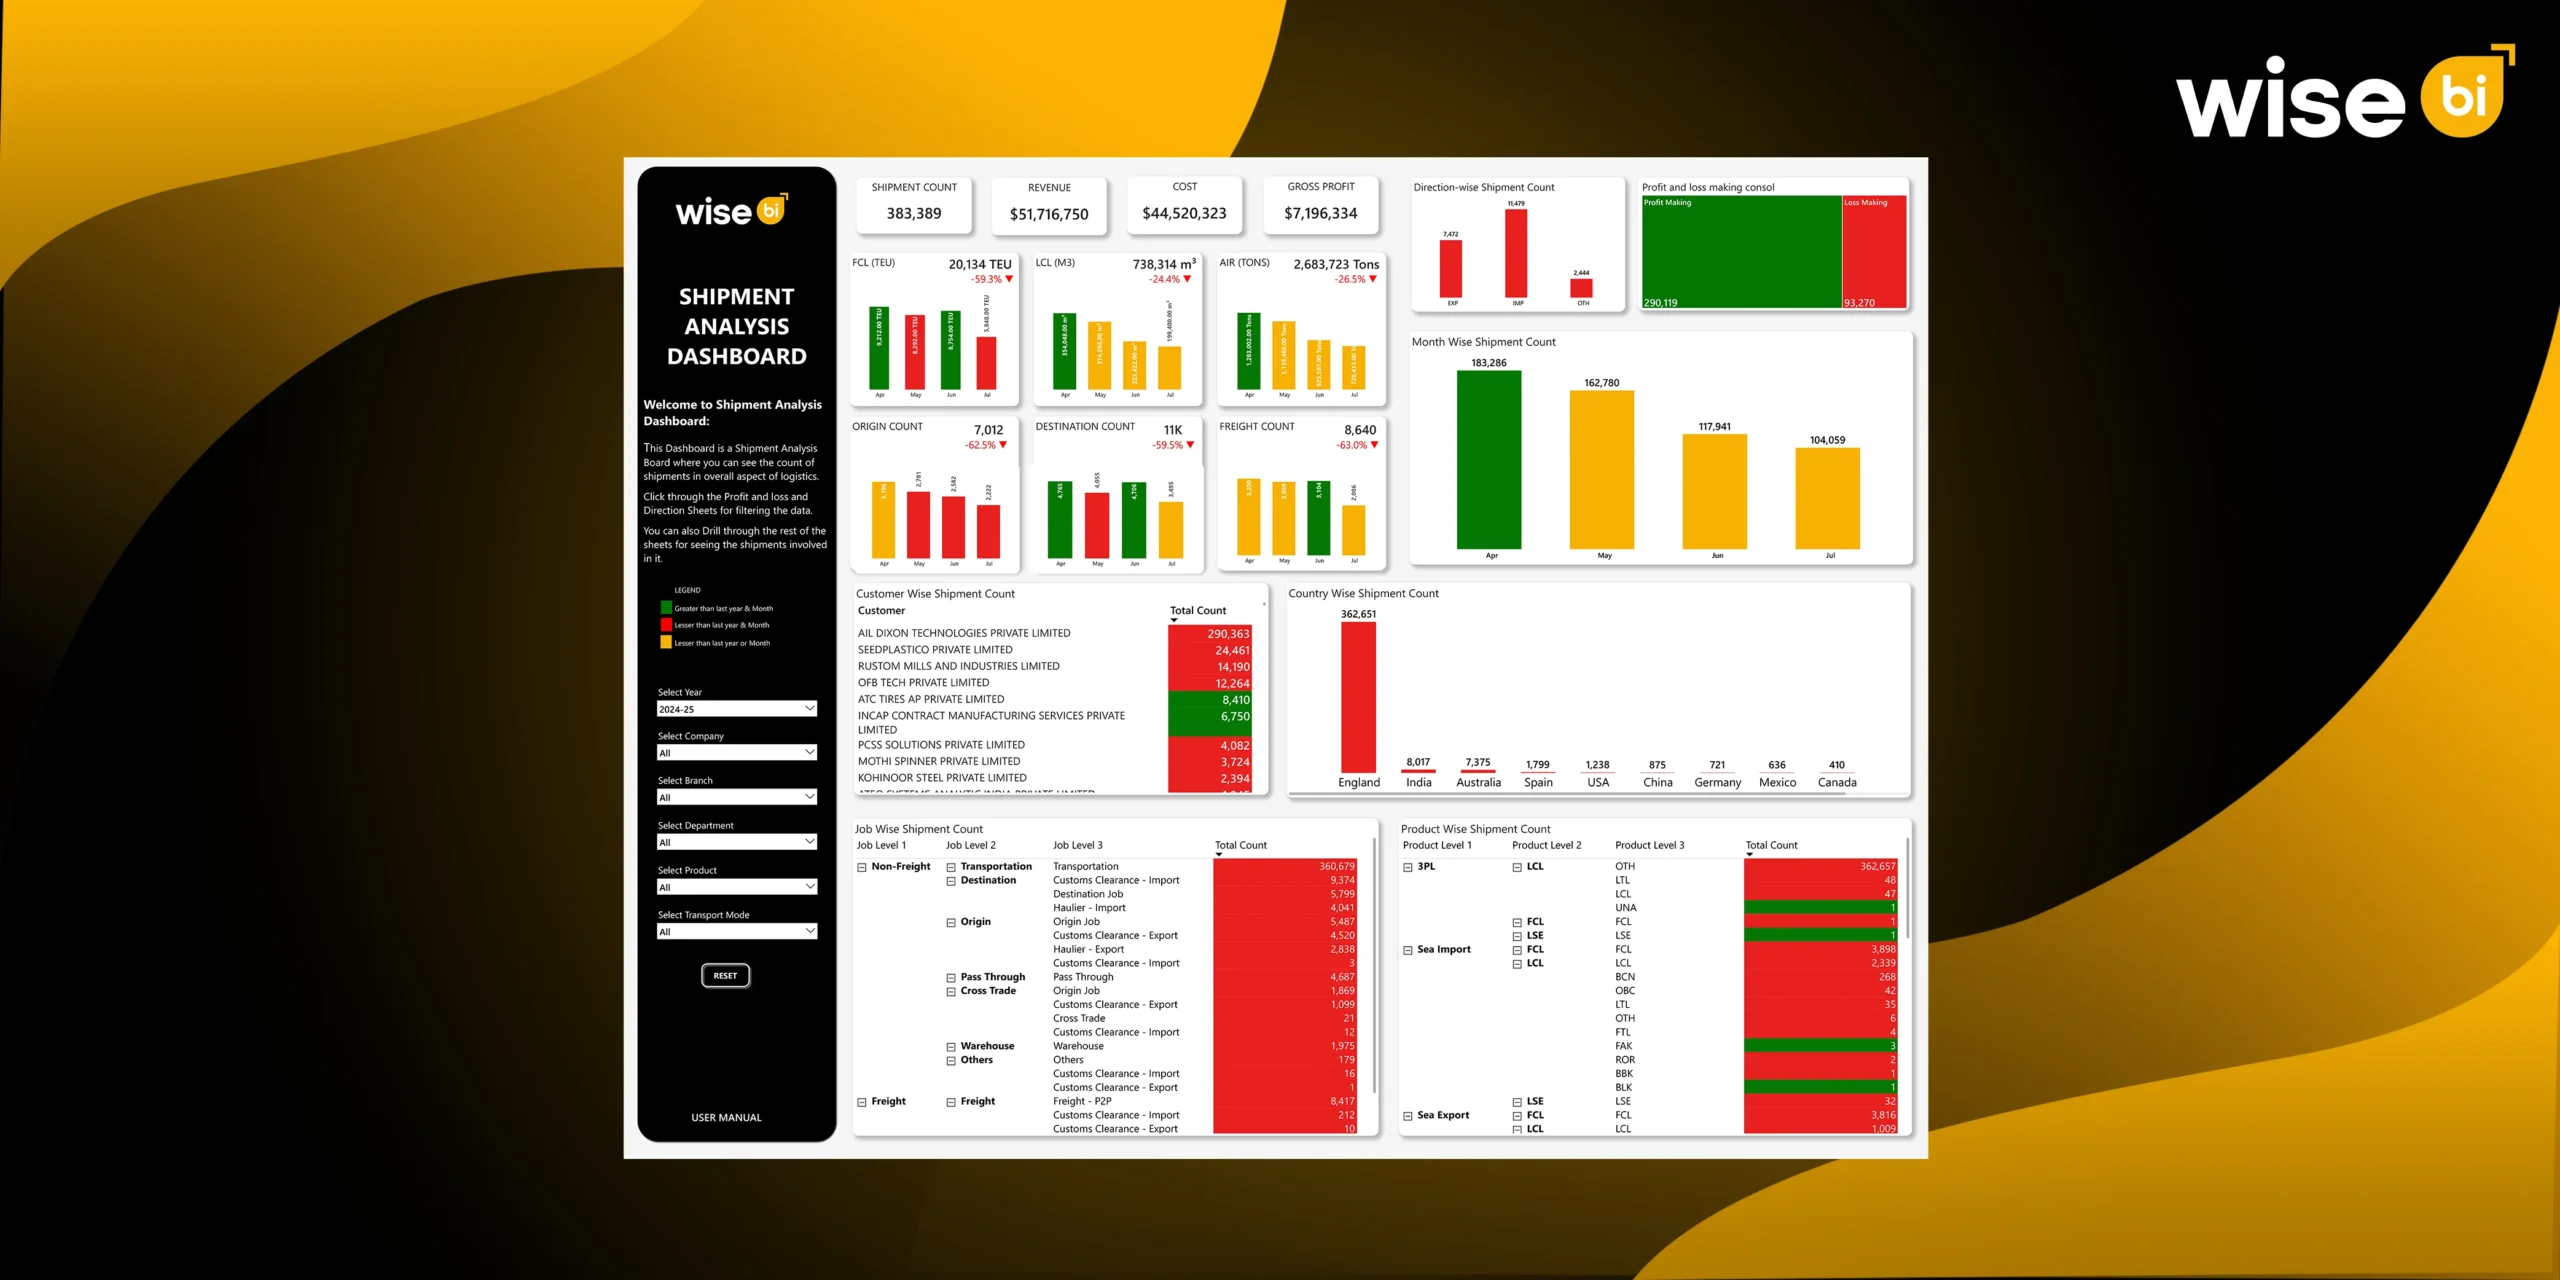
A CargoWise Shipment Analysis Dashboard helps logistics teams see beyond shipment count and understand what is really happening across revenue, cost, gross profit, customers, countries, products, and job types.
In this blog, we’ll discuss what a CargoWise shipment analysis dashboard is, why it matters, and how logistics leaders can use it to make faster, smarter, and more profitable decisions.
What is a CargoWise Shipment Analysis Dashboard?
A CargoWise shipment analysis dashboard is a BI dashboard that turns CargoWise shipment data into clear, visual insights. Instead of checking multiple reports, spreadsheets, or filtered exports, freight forwarders can view shipment performance in one place.
It helps teams track key areas such as:
- Shipment count
- Revenue, cost, and gross profit
- Profit-making vs loss-making consolidation
- Import, export, and other shipment directions
- Customer, country, job, and product-wise shipment breakdown
- FCL, LCL, and air volume trends
The BI dashboard also has drill-down visibility, which allows users to view shipment-specific information such as job number, direction, country, product, revenue, cost, gross profit, and margin. This allows teams to understand not only what is happening but also why it is happening.
Limitations of CargoWise Shipment Analysis Reports
CargoWise shipment analysis reports are useful for reviewing shipment data, job details, revenue, cost, and gross profit. However, standard reports may not always give teams the fast, visual, and connected view they need for daily decision-making.
The challenge is not the lack of data. The challenge is how quickly teams can understand that data and act on it.
CargoWise Reports are Static
Standard reports usually show historical information. They help teams review what has already happened, but they may not clearly show what needs attention right now.
This can create issues such as:
- Delayed visibility into shipment trends
- Slower response to profit drops
- Late identification of loss-making jobs
- Reactive decision-making instead of proactive action
Data Often Sits in Separate Views
Shipment performance is connected to many areas: customer, country, direction, job type, product type, revenue, cost, and gross profit. When these details are viewed separately, it becomes harder to understand the full story.
Teams may struggle to connect:
- Shipment count with profitability
- Customer volume with gross profit
- Country-wise movement with margin performance
- Job type with cost pressure
Profit and Loss Insights are Harder to Spot Quickly
A shipment may appear to be successful from an operational standpoint, but it still generates a low profit or even a loss. Without a visual profit/loss view, these issues can remain hidden within high-volume activity.
This makes it difficult to quickly identify:
- Loss-making console files
- High-volume but low-margin customers
- Cost-heavy job types
- Product categories affecting profitability
Manual Analysis Takes Time
When teams need to export, filter, compare, and clean reports manually, decision-making slows down. By the time the insight is ready, the business may have already lost time or margin.
Manual reporting often leads to:
- More spreadsheet dependency
- Higher risk of errors
- Slower commercial reviews
- Delayed operational action
Drill-Down can be Less Convenient
Reports may show that gross profit is dropping or shipment count is changing, but they do not always make it easy to identify the exact job, customer, product, or country behind the issue.
Without easy drill-down visibility, teams spend more time finding answers to questions like:
- Which job caused the loss?
- Which customer is influencing the margin?
- Which product category needs review?
- Which country or trade lane is underperforming?
Reports May Not Support Cross-Team Decisions
Operations, finance, sales, and leadership often need different views of shipment performance. Standard reports may not always present the same data in a way that works for every team.
This can result in:
- Different teams are working from different versions of data
- Slower alignment between departments
- Less clarity in customer or pricing discussions
- Missed opportunities to improve performance
CargoWise reports provide valuable data, but they may not always deliver the clarity, speed, and visual insight teams need to make confident decisions. That is why many CargoWise users require BI dashboards that transform shipment data into connected, actionable insights.
How can Shipment Analysis Dashboards Help CargoWise Users Manage Profit and Performance?
For CargoWise users, shipment analysis goes beyond counting jobs. It shows whether shipments are truly supporting growth, profit, and operational control. Even with high shipment volume, rising costs, or weak margins can create hidden risks, making clear visibility essential.
Shipment analysis matters because it connects operational activity with financial performance. It helps freight forwarders see where shipments are coming from and which customers are driving volume, whose shipments or services are performing well, and where profit leakage may be happening.
Understanding Shipment Volume vs Profitability
A high shipment count can look positive, but it does not always mean the business is performing well. Shipment analysis helps compare shipment volume with revenue, cost, and gross profit.
This helps teams understand:
- Which shipments are profitable
- Which jobs create losses
- Whether the cost is increasing faster than revenue
- Which services need pricing or process review
Helps Identify Loss-Making Jobs Faster
Loss-making shipments can be hidden among busy customers, active trade lanes, or high-volume service categories. Without proper analysis, these jobs may not become visible until they have already impacted margins.
With shipment analysis, teams can quickly review:
- Profit-making vs loss-making console files
- Jobs with weak gross profit
- Cost-heavy shipment activities
- Specific customers or countries linked to margin pressure
Improves Customer-Level Decision-Making
Not all high-volume customers are equally profitable. Some customers may generate a large number of shipments but have low profit margins due to complex requirements, frequent exceptions, or high service fees.
Shipment analysis helps account and finance teams understand:
- Which customers drive the most shipment volume
- Which accounts need pricing review
- Where service costs are affecting profitability
- Which customers deserve more strategic focus
Gives Better Visibility Across Countries and Trade Lanes
CargoWise users can understand where business activity is concentrated by analyzing shipment data by country and direction. This is useful for developing a trade lane strategy, managing risk, and identifying growth opportunities.
It helps answer questions like:
- Which countries contribute the most shipments?
- Are exports, imports, or other directions driving more activity?
- Are some lanes active but less profitable?
- Where should operations or sales focus next?
Supports Smarter Operational Planning
Shipment analysis also assists operations teams in identifying workload patterns across job types and product categories. This simplifies resource planning, team management, and service delivery.
CargoWise users can track:
- Job-wise shipment activity
- Product-wise shipment movement
- FCL, LCL, and air volume trends
- Monthly shipment fluctuations
Helps Teams Make Faster, Data-Driven Decisions
When shipment data is properly analyzed, teams spend less time chasing reports and more time acting on insights. Operations, finance, sales, and leadership can all share a common view of performance.
This leads to:
- Faster pricing decisions
- Better margin control
- Improved customer discussions
- Stronger operational planning
- More confident business decisions
In short, shipment analysis is important because it allows CargoWise users to go beyond basic reporting and understand the true performance behind each shipment.
Conclusion
A CargoWise shipment analysis dashboard allows freight forwarders to look beyond shipment counts and understand the true performance of their operations. It consolidates shipment volume, revenue, cost, gross profit, customer activity, country-specific movement, job types, product performance, and profit/loss information into a single, clear view.
For CargoWise users, this means faster analysis, improved visibility, and greater control over business performance. Instead of relying solely on static reports, teams can identify loss-making jobs, track shipment trends, analyze customer profitability, and confidently make better decisions.Want to turn your CargoWise shipment data into clear business insights? Schedule a free demo with Wise BI today!