Every late delivery has a warning sign; the right haulier KPIs allow you to detect it before the customer does.
For freight forwarders and CargoWise users, transport performance can quickly become one of the most stressful aspects of daily operations. A job may be booked, assigned to a transport company, and scheduled for delivery, but if the movement is delayed, your team must be notified quickly.
Without clear KPI visibility, operations teams frequently rely on calls, emails, spreadsheets, and manual status checks to determine what is going on. That slows things down. By the time the delay is visible, the customer may have already requested updates.
In this blog, we’ll break down the key KPIs you should track in a CargoWise haulier dashboard and how they help improve transport visibility, delay control, and haulier performance.
Key KPIs You Should Track in a CargoWise Haulier Dashboard
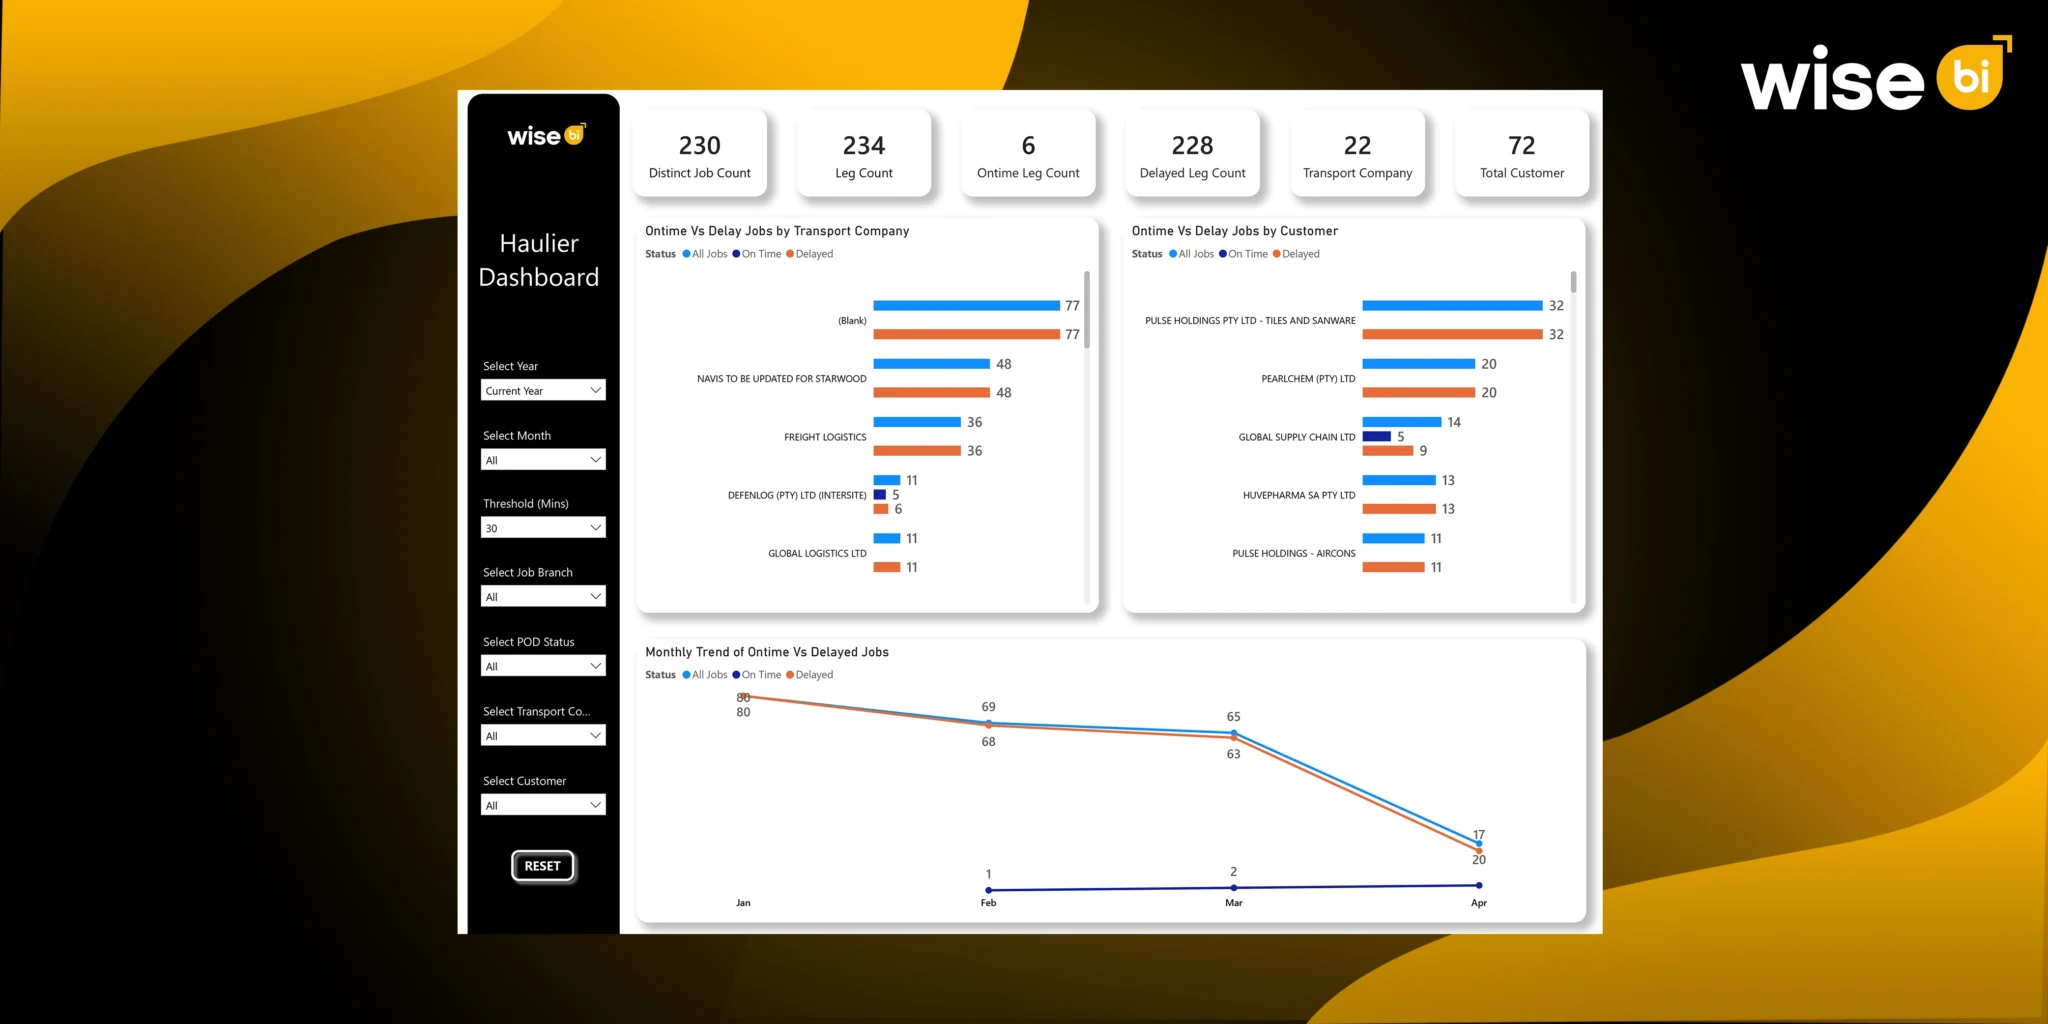
Distinct Job Count
A distinct job count shows the total number of unique transport booking numbers handled during a selected period. This KPI helps your team understand the actual number of transport jobs being managed, separate from the total number of legs.
With a distinct job count, you can understand
- How many transport jobs is your team handling?
- Is the number of jobs increasing or decreasing?
- How does transport workload compare across months, customers, or branches?
This KPI provides operations leaders with a clearer picture of transportation demand.
Leg Count
The leg count reflects the total number of transport legs or transport records executed. Leg count is one of the BI dashboard’s main KPI cards for measuring total transportation activity.
This KPI is important because transportation performance is frequently managed at the leg level. A shipment may be moved from port to depot, depot to warehouse, or warehouse to consignee. Each leg has its own schedule, responsibilities, and delivery risk.
Tracking leg count helps your team see:
- Total transport movement
- Operational workload
- Delivery volume by selected filters
- Transport activity across customers or companies
If the number of legs increases significantly, your team may need to review hauler capacity, resource planning, and delivery scheduling.
On-Time Leg Count
An on-time leg count indicates how many deliveries were completed within the specified timeframe. This KPI contributes to the measurement of transport reliability.
This KPI helps to answer a simple but powerful question:
How many transport legs meet the expected delivery time?
A high on-time leg count indicates that haulers, routes, scheduling, and delivery processes are functioning properly.
Delayed Leg Count
The delayed leg count indicates how many deliveries exceeded the selected threshold time. This KPI is a key indicator of transport performance risk.
Delayed deliveries have a direct impact on customer satisfaction, POD completion, carrier trust, and operational planning. If delays are not clearly tracked, they can accumulate quietly until customers escalate.
Tracking the delayed leg count benefits your team:
- Identify delivery issues earlier.
- Understand where transport performance is slipping
- Prioritize jobs that need attention
- Review delay patterns by transport company or customer
This KPI converts delay tracking from a guessing game to a measurable performance metric.
On-Time Percentage
The on-time percentage represents the percentage of transport legs that arrive within the specified time frame. On-time leg count displays the number of successful deliveries, whereas on-time percentage displays the overall reliability rate.
This is useful because percentages provide better context. This KPI can be used to support:
- SLA performance reviews
- Haulier scorecards
- Customer service reporting
- Monthly transport performance analysis
A high on-time percentage gives your team confidence that transportation operations are under control.
Delayed Percentage
The delayed percentage represents the proportion of transport legs delivered after the threshold time. This KPI informs your team about how much of the transportation workload is at risk.
If the delayed percentage rises, it indicates that transportation performance requires attention. It may be associated with a specific hauler, customer, organization type, or month. The BI dashboard facilitates all modes of shipment tracking by providing on-time versus delayed views by transport company, customer, organization type, and monthly trend.
The delayed percentage is useful because it allows leaders to quickly assess the size of the problem.
Transport Company Count
The transport company count indicates how many transport providers are active during the selected time period. This KPI assists your team in determining the size and spread of your haulier network.
A higher number of transport companies could indicate increased carrier usage, delivery coverage, or operational complexity. A lower count may indicate a reliance on fewer hauliers.
This KPI improves carrier management by allowing your team to review:
- How many hauliers are active?
- Whether delivery work is concentrated with certain providers
- Which transport companies need a performance review
- Whether carrier coverage is enough for the workload
This KPI gains even more value when combined with on-time and delayed performance.
Total Customer Count
The total customer count reflects the number of customers served by haulier activity. This KPI allows your team to better understand customer coverage and delivery workload.
If your customer base grows, your transportation team may need to manage more delivery expectations, site requirements, and customer-specific handling rules. This can have an impact on transit days, on-time performance, and follow-up workload.
Tracking customer count helps you understand:
- How many customers participate in the transportation activity?
- Is the delivery workload spread across many customers?
- Which customers may need closer performance monitoring?
- How does customer volume affect transport planning?
This KPI, when combined with a customer-specific on-time versus delayed analysis, assists your team in determining which accounts require immediate attention.
Average Transit Days
Average transit days represent the average delivery time calculated from arrival to completion. This KPI is used to assess transportation speed and delivery efficiency.
The BI dashboard displays average transit days by transport company and customer, allowing teams to compare delivery times across providers and accounts.
Average transit days help your team review:
- Delivery speed by haulier
- Customer-specific delivery complexity
- Route or depot-related delays
- Operational efficiency over time
If one transport company has longer average transit days than others, your team can look into carrier performance, route planning, waiting time, and POD delays.
Common Transport Problems these KPIs Help Solve
A CargoWise haulier dashboard helps solve the daily transport visibility challenges that freight forwarders often face. Instead of relying on scattered reports or manual checks, your team can use KPI insights to understand where delays are happening, which hauliers need attention, and which customers are affected.
These KPIs help your team:
- Identify delayed deliveries before they become customer retention
- Compare the performance of transportation companies in greater detail
- Improve haulier accountability with on-time and delayed delivery data
- Understand customer-level delivery issues faster
- Reduce manual follow-ups across teams
- Make quicker decisions based on measurable transportation performance.
Most importantly, when delays are visible and can be traced back to the correct carrier, customer, or transport leg, your team can act faster and more effectively manage delivery performance.
Conclusion
Tracking the right KPIs in a CargoWise haulier dashboard allows freight forwarders to improve delivery visibility, reduce delays, and manage transportation performance with greater confidence.
With KPIs such as distinct job count, leg count, on-time and delayed legs, on-time percentage, delayed percentage, transport company count, customer count, and average transit days, your team can gain a better understanding of daily haulier performance.
Instead of chasing updates, your team can see what needs to be addressed and act quickly.If you’re a logistics leader looking to improve delivery visibility and reduce transportation delays, schedule a free demo with Wise BI to see how a CargoWise Haulier Dashboard can help your team take control.