Delivery delays do not begin with a customer complaint; rather, they begin with a transport leg that your team was unable to see in time.
A transport job may appear simple within the CargoWise system: book the job, assign the haulier, move the goods, update the POD, and close the leg. However, every transport leg contains moving parts. One delay can result in customer follow-ups, internal calls, missed delivery deadlines, and back-and-forth.
The CargoWise haulier dashboard can be useful in this situation. It gives your team a complete picture of delivery performance across transport legs, customers, transport companies, organization types, and transit times. Instead of jumping between reports or waiting for manual updates, you can see what is on time, what is late, and where your team needs to step in. This is why freight forwarders prefer Power BI dashboards.
What is a CargoWise Haulier Dashboard?
A CargoWise Haulier Dashboard is a business intelligence dashboard that transforms CargoWise haulier and transport leg data into clear, visual delivery insights. Instead of switching between reports or waiting for manual updates, you can view how your transportation jobs are performing in one place.
The BI dashboard explains how goods move through transport legs from origin to destination. Each job can be tracked based on delivery timelines, allowing your team to assess transportation efficiency and identify delays faster.
With this BI dashboard, you can quickly answer practical questions like
- How many transport legs were executed?
- How many jobs were completed on time?
- Which legs were delayed?
- Which transport company needs closer review?
- Which customers are facing repeated delays?
- How is delivery performance changing month by month?
- Which organization types are receiving more delivery activity?
This is especially useful for freight forwarders, as delivery performance directly influences customer satisfaction. Even if documentation, warehouse handling, and shipment planning are all done correctly, a delayed transport leg can still result in a negative customer experience.
What Key Data Visualizations does the BI Dashboard Offer?
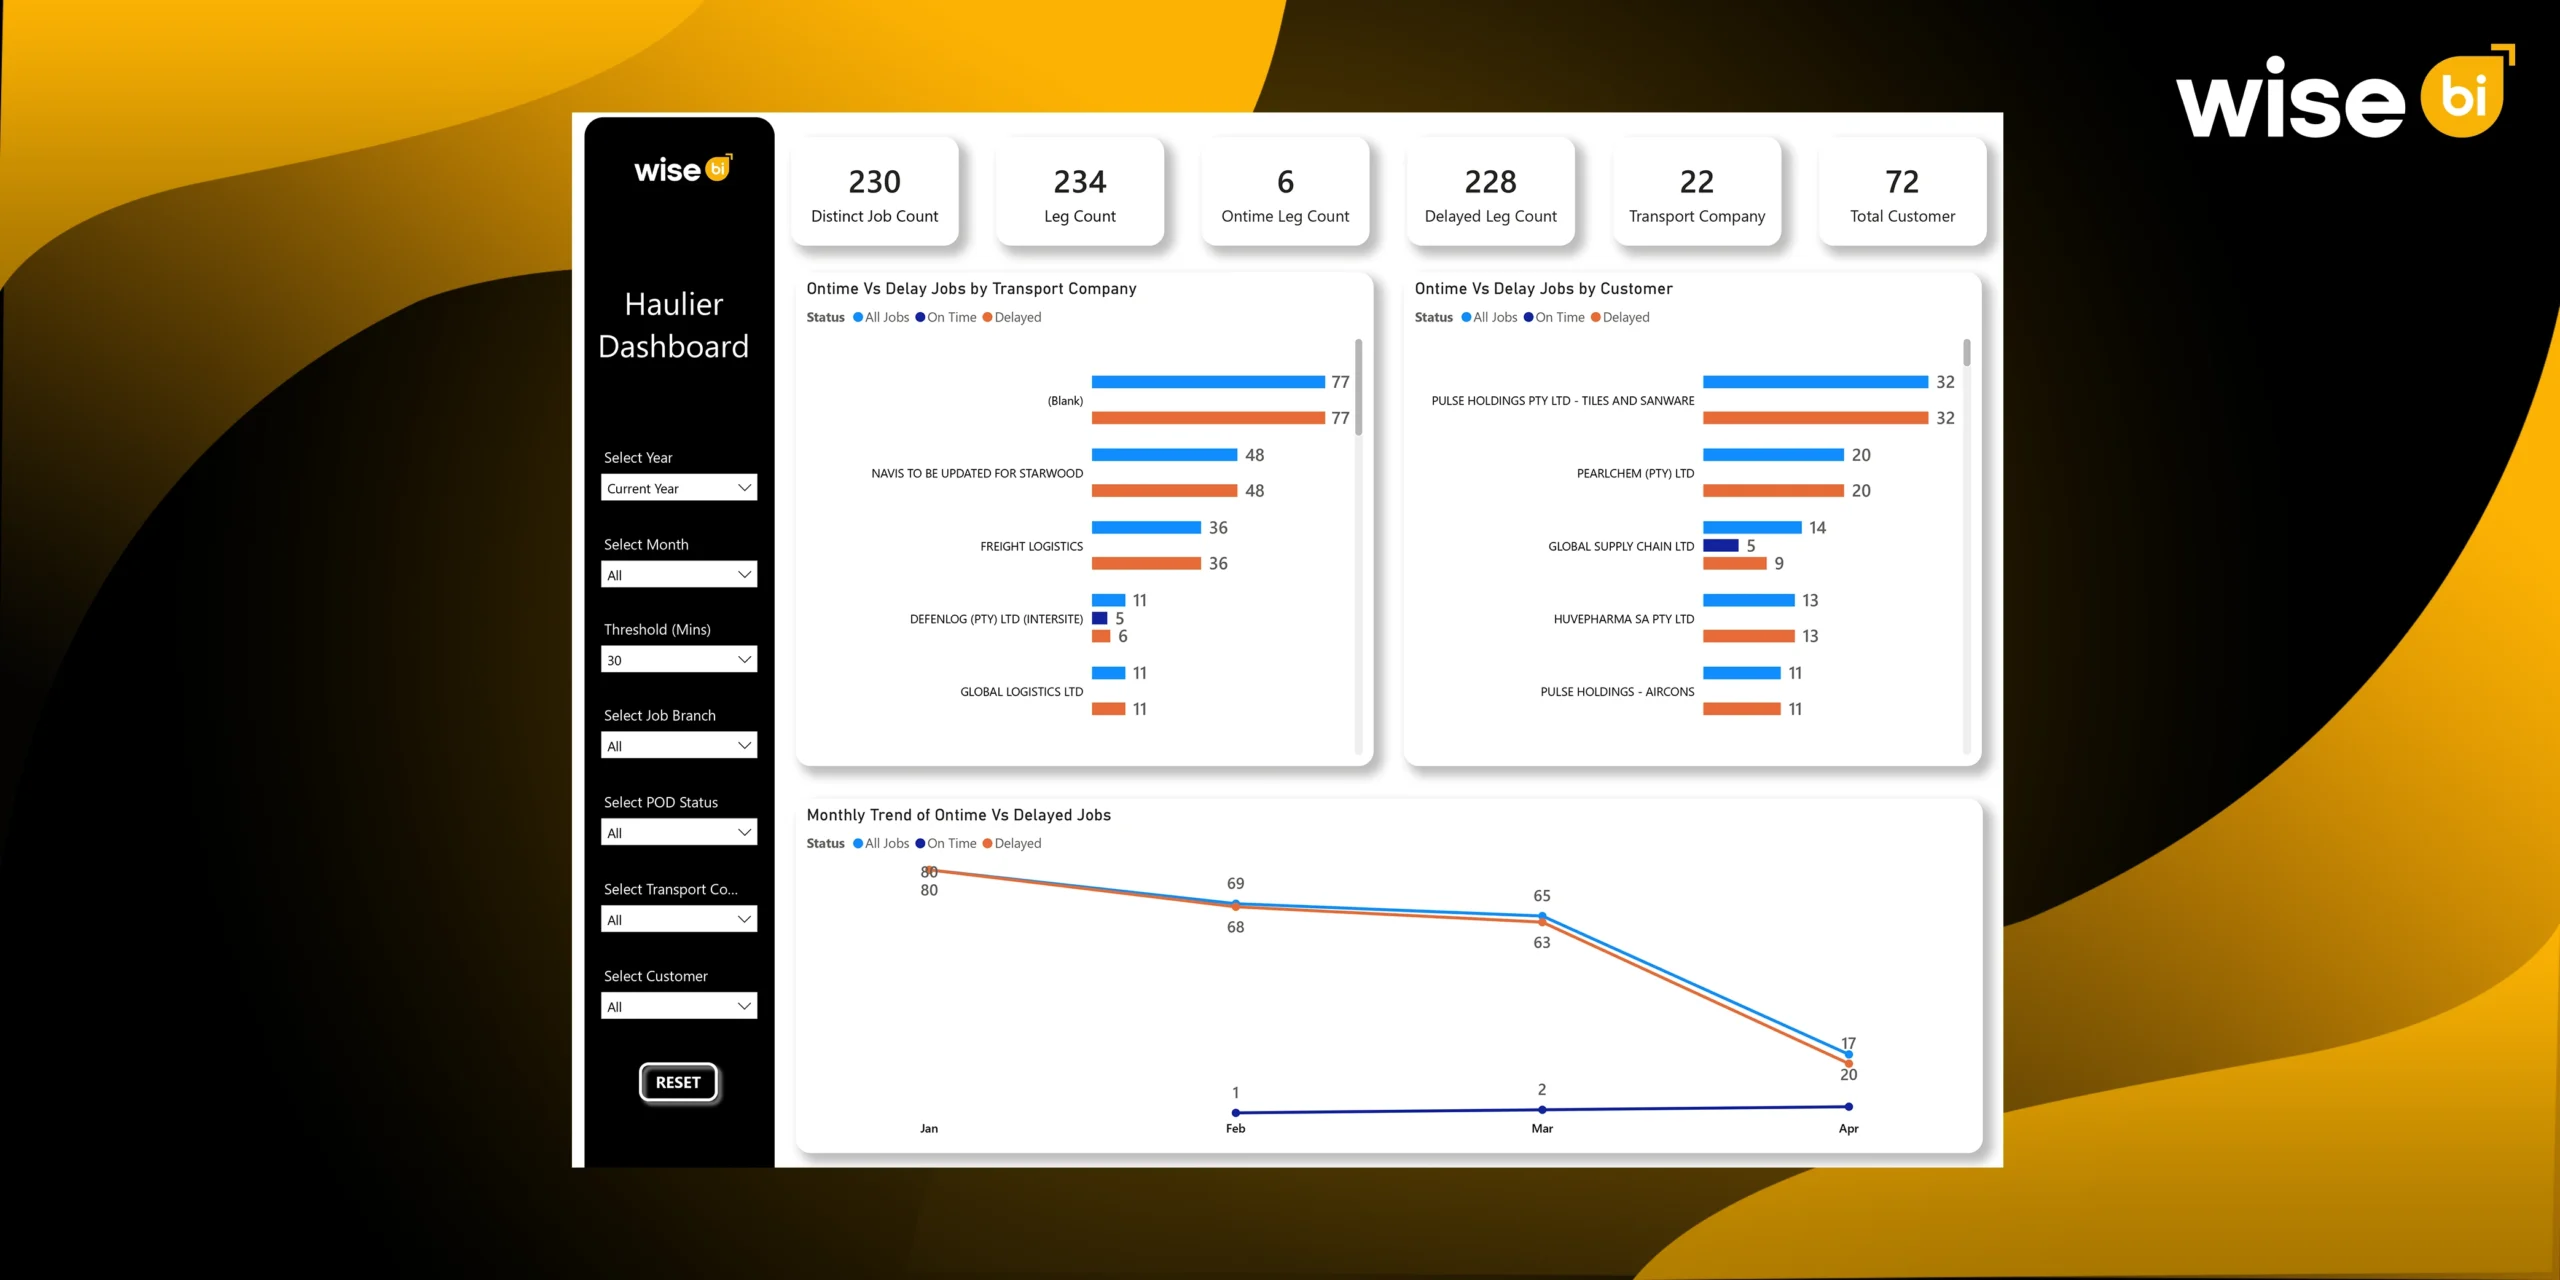
A good CargoWise BI dashboard should not require your team to work harder. It should make finding answers easier. The CargoWise haulier dashboard includes several visual views that allow you to understand delivery performance without having to sift through rows of data.
On-Time vs Delayed by Transport Company
You can compare delivery performance across transportation providers. This allows you to see which hauliers are completing jobs on time and which are causing additional delays.
Instead of guessing who is causing service issues, you can thoroughly review performance and use the results in haulier review meetings.
On-Time vs Delayed by Customer
You can also check the customer’s delivery performance. This allows your team to determine whether specific customers are consistently affected by delays.
For example, if a single customer has a history of job delays, your operations or customer service team can investigate why. It could be site access, appointment times, route issues, or documentation delays.
The benefit is straightforward: you can identify the pattern before the customer files a complaint.
Monthly On-Time vs Delayed Trend
The monthly trend view shows whether delivery performance is improving or worsening over time.
One delayed job may not be a big deal. But if the delays continue month after month, it indicates a larger problem. With the trend view, your team can determine whether corrective actions are effective.
Average Transit Days by Transport Company
This view allows you to compare how long the transportation company’s deliveries take. If one haulier consistently takes longer than others, your team can investigate why.
It could be route planning, depot wait times, driver availability, POD delays, or customer delivery restrictions. The dashboard provides a starting point for your team’s discussion.
Average Transit Days by Customer
You can also see the average transit time per customer. This allows you to determine whether certain customers naturally take longer due to delivery location, unloading rules, booking windows, or special handling requirements.
This insight contributes to better planning and more realistic service commitments.
Organisation Type Analysis
The BI dashboard compares delivery performance by organization type, such as consignee/importer, container yard, CFS/depot, and CTO/wharf.
This allows you to better understand where transportation activity is concentrated. Waiting times for deliveries to a container yard may differ from those at a consignee site. A depot may present unique operational challenges in comparison to a wharf.
When you understand this clearly, your team can plan more effectively.
On-Time vs Delayed Distribution
The donut chart provides a quick snapshot of delivery health. It displays the overall split between on-time and delayed legs, allowing managers to quickly assess performance.
If delayed legs begin to increase, your team will know where to focus.
Drill-Through Job Details
Summary charts are useful, but they don’t always explain why a delay occurred. That is why drill-through detail matters.
With job-level visibility, your team can see booking information, company, customer, delivery dates, POD status, and delay status. This enables you to transition from “something is delayed” to “this specific job requires action.”
Why is Haulier Performance Visibility Important for Freight Forwarders using CargoWise?
Haulier performance is one of the most noticeable aspects of the customer experience. Your customer may not see all of the work that goes on behind the scenes, but they will notice if the delivery is delayed.
With improved haulier visibility, you can avoid surprises and manage transportation exceptions earlier.
It helps your team:
- Identify delayed deliveries before they become escalations
- Compare transport companies using actual performance data
- Track customer-specific delivery issues
- Reduce time spent on manual follow-ups
- Support stronger carrier performance reviews
- Improve POD and milestone visibility
- Give customer service teams better answers
Consider this: instead of asking your team, “Where is this delivery?” you can use the BI dashboard to see where the delay is coming from.
This saves time. It also builds confidence.
The BI dashboard helps operations managers maintain better daily control. It improves the quality of customer service responses. For leaders, it provides a clearer picture of transport reliability across carriers, customers, and time periods.
How can the Dashboard Help Operations Teams Improve Transportation Performance?
A CargoWise haulier dashboard enables your operations team to transition from reactive follow-up to proactive control.
Instead of waiting for customers to ask about delays, your team can compare performance by haulier and identify delayed legs that need to be attended to by the transport company. You can keep an eye on delivery trends all month long instead of waiting for month-end reviews.
This helps you:
- Monitor delivery status more clearly
- Identify delayed jobs earlier
- Compare haulier performance
- Track customer-wise delivery trends
- Review monthly transport performance
- Support SLA discussions with data
- Reduce manual follow-ups
- Improve carrier and resource planning
For example, if one transport company consistently delays, your team can look at the job details, customer patterns, POD status, threshold time, and average transit days. Then you can determine whether the problem is with the hauler’s performance, the customer’s location, depot delays, or planning.
This is how your team transitions from firefighting to better transport control.
Conclusion
A CargoWise haulier dashboard gives freight forwarders a clearer way to manage transport performance across jobs, customers, transport companies, organization types, and delivery timelines. It shows which legs are on time, which are delayed, where delays happen, and how performance is changing.
This visibility helps CargoWise users make quicker transport decisions, strengthen communication, decrease manual follow-ups, and enhance carrier accountability.
Delivery performance is not just about moving goods. It is about keeping promises.Want to improve transport visibility in CargoWise? Book a free demo with Wise BI to see how our haulier BI dashboard can track delivery performance, reduce delays, and support faster decisions.