CargoWise users work in a dynamic and ever-changing logistics environment in which efficient shipment management is essential to success. Data-driven decision-making and actionable insights are more important than ever in this environment. This is where a Business Intelligence (BI) dashboard for shipment analysis is essential.
CargoWise users may gain important insights into their shipping operations, save expenses, and increase operational efficiency by leveraging data visualization and analytics. Let us go deeper into why CargoWise users require a BI dashboard for shipment analysis.
Understanding the Importance of Shipment Analysis
Shipment analysis is critical for logistics organizations that want to acquire useful insights into their shipping operations, improve operational efficiency, and increase customer happiness. Companies may find trends, detect inefficiencies, and optimize supply chain processes by analyzing elements such as transit durations, delivery accuracy, and freight costs. This data-driven strategy enables those making decisions to make more informed decisions that lower costs, improve operations, and strengthen service standards.
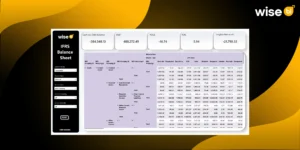
BI Dashboard for Shipment Analysis
Improve your decision-making by obtaining a 360° view of your shipping performance. This dashboard can assist you in monitoring, analysing, and understanding a shipper’s monthly, quarterly, and semi-annual performance. Moreover, dashboards allow you to track shipment performance across regions, receive an overview of shipment delays, and better understand your key customers.
A BI dashboard for shipment analysis collects, normalizes, and validates shipment data from diverse sources, giving customers a comprehensive perspective of their shipping activity. It uses predictive analytics and cost modelling to provide actionable insights and recommendations for improving shipping processes and lowering expenses.
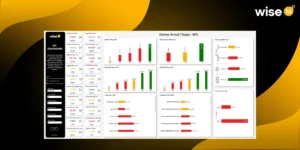
- Monitor shipment KPIs and compare them with the industry standard.
- Track the performance of your company in various locations.
- Identify essential customers by knowing the volume and average value of each shipment.
- Gain a thorough understanding of shipping delays.
Factors Affecting Shipment Costs
Shipment costs are influenced by several factors, such as
- Carrier fees
- Delivery time
- Package weight
- Parcel dimensions
- Taxes
- Surcharges
CargoWise users have to carefully examine these elements to optimize transportation costs and maintain their market position.
Key Performance Indicators for Shipment Analysis
Key performance indicators (KPIs) include the accuracy of orders and shipments.
- Delivery time
- Identifying and addressing potential deficiencies in shipping procedures
- Inventory tracking, which includes returns
- Order quantity and shipment status
- Transportation-related expenses
- Costs and management for facilities and warehouses
CargoWise users must monitor these KPIs to analyze the effectiveness and dependability of their shipping processes.
Wise BI’s Role in Better Shipment Analysis
The data-driven insights combined with predictive analytics, customized reporting, and performance monitoring tools are very essential to unlocking revenue growth. With our expertise in Tableau and PowerBI skills, companies can convert numbers into information that aids their decision-making and contributes greatly to the growth of their revenues.
Predictive analytics catches future trends, customized reporting creates an aim for taking action, and performance monitoring monitors the main metrics for uninterrupted improvement. Let us now look at what we can do for you.
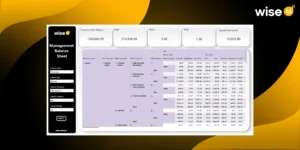
Volume and Job Count Analysis
Unlock the Power of Data with Volume and Job Count Analysis.
- Understand your operations’ volume, job count, transit summary, ocean summary & air summary.
- Tailored reports that align with your business’s needs, such as estimated time of arrival (ETA), estimated time of departure (ETD), actual time of arrival (ATA), and actual time of departure (ATD).
- Precision and reliability in data reporting, with meticulously structured & validated reports.
- Foster smooth collaboration & communication among stakeholders, ensuring seamless operations.
Tradelane and Continental Analysis
Elevate Your Business Insights with Tradeline and Continental Analysis.
- Elevate Your Business Insights with Tradelane and Continental Analysis
- Unlock invaluable insights into the top 5 trade lanes by volume, job count, and continent.
- Get proper information on trade patterns, routes, and market dynamics.
- Accurate data through our meticulous report structuring and validation process.
- Seamless collaboration and communication are established among stakeholders.
Wise BI’s solutions to the problems faced by CargoWise customers
| Challenge | Pain Point | Wise BI’s Solution |
| Reports Download Efficiency | Multiple logins are required for extracting Job Profit reports; a time-consuming process hindering operational efficiency and productivity. | We offer centralized login integration that simplifies Job Profit report retrieval, boosting efficiency and accelerating workflow for enhanced productivity. |
| Group-level Reports | Users have to manually download job profit reports from multiple countries which can hinder efficiency and group-level analysis. | Our automated collation system simplifies the process, enabling seamless consolidation of job profit reports from various countries for efficient group-level analysis. |
| CargoWise Technical Expertise | Generally, users need more CargoWise technical skills to modify or add new fields to system reports and more. | We bridge the gap by providing training and support, enabling users to customize reports without extensive IT intervention independently. |
| Pass-Through Charges | Unable to exclude pass-through transactions in job profit reports which require manual intervention in charge code filters. | Wise BI introduces a customizable filter for seamless removal of Pass-Through charges, simplifying the reporting process and enhancing efficiency. |
| Intercompany Transactions | Users must manually remove the intercompany transactions for accurate group-level job profit reports that can lead to errors. | We can automate intercompany transaction removal which will minimize errors, ensuring precise group-level job profit reporting with enhanced efficiency. |
Conclusion
In conclusion, using a BI dashboard for shipment analysis might be very beneficial for CargoWise users. CargoWise users may acquire important insights into their shipping operations, cut expenses, and increase overall efficiency by employing advanced analytics and visualization capabilities. Investing in a BI dashboard is critical for being competitive in the fast-changing logistics business.
Are you prepared to transform your shipment analysis and achieve new heights of effectiveness in your logistics processes? You can reduce your shipping costs, save expenses, and promote business growth by having access to useful information. Start using BI dashboard integration to improve your CargoWise experience right now. With our expertise in creating BI dashboards for shipment analysis make your shipping business prosper!