Customer churn rarely happens overnight.
A freight forwarding customer may start booking less often, go quiet for a few months, reduce shipment frequency, or gradually shift business elsewhere. By the time the account is officially considered lost, the warning signs may have been visible for weeks or even months.
For freight forwarders using CargoWise, those warning signs already exist in customer activity, revenue, cost, profit, purchase history, and active-month data.
The challenge is seeing them early enough to act.
What is a CargoWise Customer Attrition Dashboard?
A CargoWise customer attrition dashboard is a business intelligence tool that demonstrates how customers are acquired, retained, and lost over time.
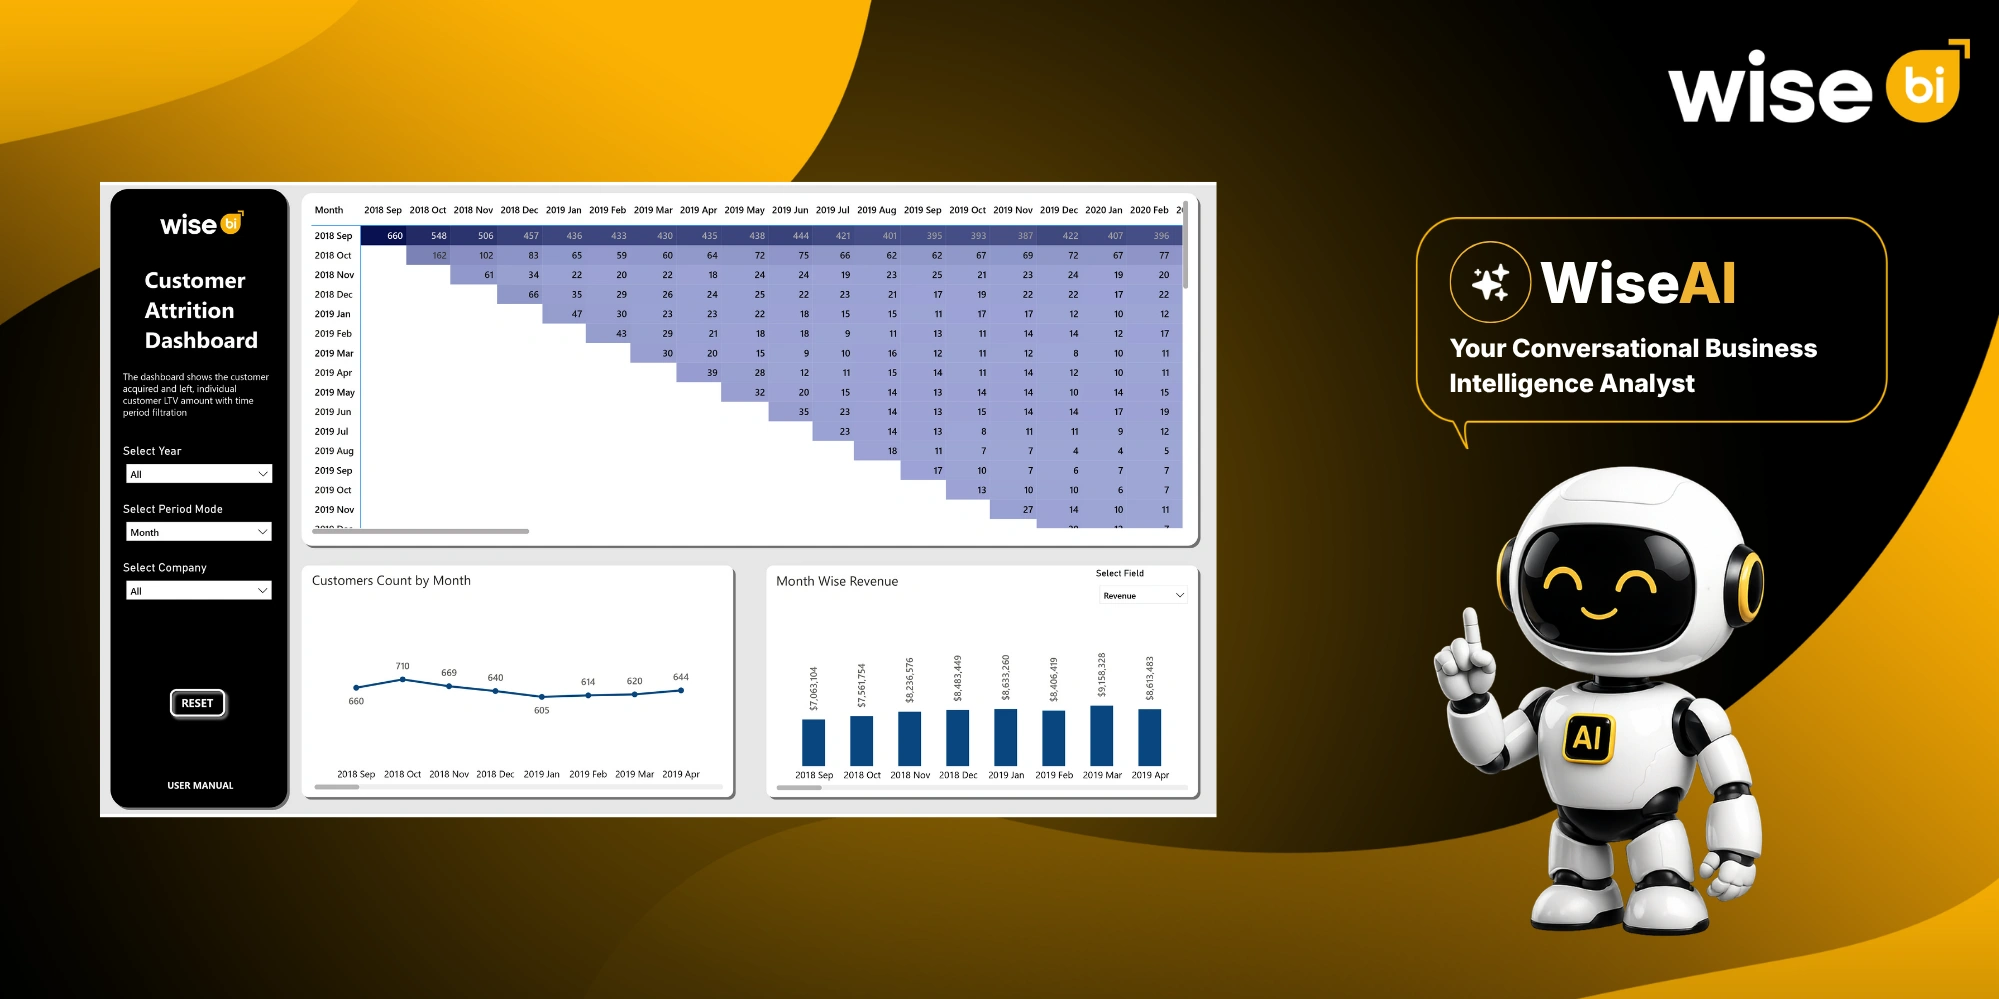
It allows freight forwarders to track customer acquisition, retention, activity, and churn trends over time. It combines customer counts, active months, revenue, cost, profit, profit percentage, purchase history, and retention trends to help commercial and management teams identify customers who are losing momentum before the relationship ends.
Instead of focusing solely on current customer revenue, it helps answer a broader question:
Are customers continuing to do business with us, or are they gradually becoming inactive?
The BI dashboard includes:
- Customer retention matrix
- Active customer count by month
- Revenue and other value trends
- First purchase month
- Last purchase month
- Total months
- Active months
- Customer profit
- Total customer count
- Total revenue
- Total cost
- Total profit
- Profit %
- Customer activity range
- Customer-level profit contribution
Users can also filter by year, company, reporting period, and selected financial field.
This gives freight forwarders a better understanding of how customer relationships evolve.
Why is Customer Churn Difficult to Spot Early?
The biggest challenge with customer attrition is that a customer may still look active while the relationship is weakening.
Revenue may still be coming in. A few jobs may still be moving. The account may not yet be classified as lost.
But the pattern may be changing.
A customer who had previously booked every month may now only book occasionally. Another may still be active, but with lower revenue or profit. Some customers may remain in the system for years despite being active for only a portion of that time.
Teams that focus solely on current revenue or customer count are more likely to overlook these changes.
That is why customer attrition analysis must link activity patterns with financial value.
Utilize the Attrition Matrix to Visualize Retention Over Time
The customer retention matrix is one of the dashboard’s most useful features.
The matrix shows how many customers acquired in a given month continue to be active in subsequent months. Rows represent acquisition months, and columns represent subsequent retention periods.
This helps freight forwarders understand where the customer drop-off begins.
Rather than just knowing how many customers were acquired, teams can see how long those customers are active.
A sharp drop between periods could indicate that a group of customers is becoming inactive faster than expected.
This provides commercial teams with a practical starting point for addressing retention issues.
Track Active Customer Count Month by Month
The CargoWise customer attrition dashboard also includes a trend line showing the total number of active customers each month.
This is important because customer retention should be viewed as a trend, not a single number.
If active customer count steadily declines, it may suggest that customer loss is outpacing acquisition or reactivation.
If the count improves, teams can see whether retention or new business is strengthening the customer base.
The value here is visibility.
Instead of waiting for annual customer reviews, freight forwarders can monitor whether the active customer base is expanding, stable, or shrinking.
Understand First Purchase, Last Purchase, and Active Months
Customer history provides some of the clearest signs of potential attrition.
The detailed customer view includes:
- First Purchase Month
- Last Purchase Month
- Total Months
- Active Months
- Profit
These fields help teams understand the true depth of the relationship.
A customer may have been with the company for several years but was only active for a few months.
That is an important distinction.
The difference between total relationship length and active months can aid account managers in identifying customers with irregular engagement, whereas the last purchase month provides a clear indication of how recently the customer has done business.
Combine Customer Activity with Revenue, Cost, and Profit
Customer retention should not be measured only by whether an account remains active.
The value of that account also matters.
The WiseBI’s CargoWise customer attrition dashboard allows users to analyze financial measures such as revenue, cost, net revenue, or profit and profit % alongside customer activity.
This helps freight forwarders separate:
- Active and profitable customers
- Active customers with declining value
- Infrequent customers with meaningful profit
- Customers showing both weaker activity and weaker financial contribution
This is especially important for retention planning.
Not every inactive customer deserves the same level of commercial effort. Combining attrition signals with customer value helps teams prioritize where retention activity may have the greatest business impact.
Discover How Customer Value Changes Over Time
The BI dashboard includes a value chart that allows you to track specific financial measures over time.
Users can navigate between fields like revenue, net revenue, net revenue percentage, and cost.
This adds a new layer to customer attrition analysis.
A customer may still appear active, but revenue or profit contribution may be decreasing.
Such a gradual decline can serve as an early warning signal.
When activity and financial performance decline simultaneously, commercial teams have a stronger reason to investigate the relationship.
Segment Customers by Active-Month Range
The BI dashboard also categorizes customers based on how many months they have been active.
This enables teams to view the distribution across different ranges, such as shorter-term and long-term active customers. This allows freight forwarders to distinguish between newer customers, intermittent customers, and longer-standing relationships.
The longer a profitable customer remains active, the more commercially significant the relationship may become. As a result, active-month segmentation can be used to analyze customer retention as well as overall customer lifetime value.
Use Filters to Focus on the Right Customer Segment
Customer attrition should not always be analyzed across the entire business.
The dashboard supports filters for:
- Year
- Period mode
- Company
- Selected financial field
The period mode can be switched between month, quarter, and year, allowing teams to review retention patterns at different levels of detail.
Users can also drill through to analyze deeper customer-level information.
This makes it easier to move from a broad customer retention trend to the specific customer group that needs attention.
Turn Attrition Insights into Retention Action
The BI dashboard is most useful when it allows for regular customer reviews.
For freight forwarders, that means commercial and account-management teams can use the dashboard to identify:
- Customers are becoming less active
- Accounts with declining revenue or profit
- Customer groups with higher drop-off
- High-value customers showing early churn signals
- Long-term customers worth protecting
By identifying changes in customer activity, revenue, profit, and retention patterns earlier, freight forwarders can take a more proactive approach to predicting and preventing customer loss before declining engagement develops into long-term inactivity.
Make Customer Attrition Analysis Easier with WiseBI
WiseBI brings CargoWise customer activity and financial data into a focused attrition view, helping teams understand retention patterns without manually comparing separate customer reports.
Conversational BI can improve the dashboard experience by allowing users to ask natural-language questions about customer activity, revenue, profit, or retention patterns, followed by follow-up questions to refine the analysis.
This enables commercial, operations, finance, and management teams to shift their focus from a general churn concern to a specific customer or time period.
Conclusion
Customer churn is easier to address when freight forwarders can see the warning signs early.
A CargoWise customer attrition dashboard displays acquisition, retention, active customer counts, first and last purchase dates, active months, revenue, cost, profit, profit percentage, and customer activity ranges in a single view.
This enables teams to identify declining engagement, understand customer value, prioritize retention efforts, and strengthen customer relationships before inactivity leads to churn.
Schedule a free demo with WiseBI to see how CargoWise’s customer attrition insights can help your commercial, account management, finance, operations, and business intelligence teams identify at-risk accounts and improve customer retention.