Your logistics ERP is only part of the picture
Modern logistics companies rely on ERP systems to manage freight forwarding, transportation, warehousing, customs clearance, accounting, invoicing, and customer operations. These platforms simplify day-to-day processes and ensure business transactions are recorded accurately.
However, many logistics leaders still face a common challenge: they have plenty of data but very little actionable insight.
An ERP tells you what happened: a shipment was booked, an invoice was issued, or a payment was received. But it rarely explains why performance changed, where profitability is declining, or which customers and trade lanes are driving business growth.
As freight operations expand across multiple branches, countries, services, and transportation modes, standard ERP reports often become insufficient for strategic decision-making.
This is where the ROI of BI dashboards adds significant business value.
Rather than replacing your ERP, BI dashboards extend its capabilities by transforming operational data into meaningful, real-time business intelligence.
What is a Logistics BI Dashboard?
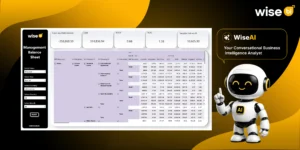
A logistics BI dashboard is an interactive analytics platform that connects directly to your ERP and other business systems to present operational and financial information through dynamic visualizations.
Instead of manually exporting reports into spreadsheets, executives can access live dashboards showing the metrics that matter most.
A logistics BI dashboard can consolidate information from the following:
- Logistics ERP
- Transportation Management Systems (TMS)
- Warehouse Management Systems (WMS)
- CRM platforms
- Accounting software
- Customer portals
- Rate management systems
- External business applications
- Other in-house systems
This creates a single source of truth for the organization, ensuring everyone works with consistent and up-to-date information.
Why aren’t ERP Reports Enough?
ERP systems excel at processing transactions but are not designed to deliver advanced business analytics.
Many logistics companies still depend on manually generated reports, resulting in several challenges:
Limited Real-Time Visibility
Most ERP reports provide historical information rather than live operational performance. Managers often receive reports after opportunities have already been missed.
Disconnected Business Data
Critical information may exist across finance systems, CRM platforms, warehouse software, and customer portals. Without integration, gaining a complete business picture becomes difficult.
Time-Consuming Reporting
Teams spend valuable hours exporting data, cleaning spreadsheets, and preparing management reports instead of analyzing business performance.
Limited Analytical Capabilities
Traditional ERP reports answer basic operational questions but struggle to identify trends, exceptions, profitability drivers, or future opportunities.
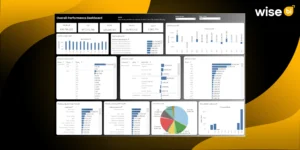
BI Dashboards Unlock More Value from Your Logistics ERP
Every logistics ERP stores valuable operational and financial data, but extracting meaningful insights from that information can be challenging. BI dashboards consolidate and visualize ERP data in real time, enabling logistics companies to monitor KPIs, improve performance, and make data-driven decisions.
Turn Raw Data into Actionable Insights
Every shipment, invoice, quotation, and customer interaction generates valuable information.
BI dashboards organize this data into meaningful KPIs, trends, and visual reports that executives can understand instantly.
Instead of reviewing hundreds of rows in spreadsheets, managers immediately see:
- Revenue performance
- Shipment growth
- Profit margins
- Customer trends
- Branch performance
- Financial health
This significantly improves decision-making.
Gain Real-Time Business Visibility
Freight operations change constantly.
Shipment delays, increasing transportation costs, fluctuating fuel prices, or customer demand shifts require immediate action.
BI dashboards continuously refresh ERP data, allowing businesses to monitor operations as they happen rather than relying on yesterday’s reports. Real-time visibility enables faster responses and minimizes operational risks.
Improve Business Performance
Logistics businesses benefit from BI dashboards that provide complete visibility into customer, revenue, and volume performance. A country insights dashboard enables organizations to compare revenue, shipment volume, and profitability across different countries from a single view.
Important metrics include:
- Revenue by customer
- Gross profit by customer
- Quote-to-booking conversion rate
- Shipment volume
- Customer acquisition
- Sales pipeline
- Revenue by trade lane
- Salesperson performance
- Service-wise revenue
These insights help sales managers focus on high-value opportunities and improve customer retention.
Strengthen Financial Decision-Making
Finance departments rely on precise, timely data to maintain healthy cash flow and profitability. BI dashboards simplify financial reporting by providing instant access to revenue trends, profit margins, receivables, payables, cash flow, and outstanding invoices, all in one easy-to-understand view.
It provides instant access to:
- Revenue trends
- Gross profit
- Net profit
- Accounts payable visibility
- Cash flow
- Outstanding invoices
- Aging reports
- Branch profitability
- Cost analysis
Instead of waiting until month-end, finance teams can identify risks earlier and make proactive decisions.
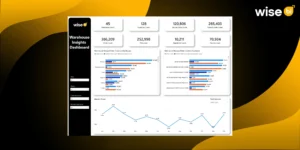
Optimize Operational Efficiency
Operations teams can monitor every stage of the logistics process through centralized dashboards.
Examples include:
- Shipment analysis performance
- Delivery performance
- Warehouse performance
- Container utilization
- Carrier performance
- Customs clearance timelines
- Transit delays
- Booking turnaround time
This visibility helps organizations reduce bottlenecks and improve service quality.
Connect Every Department through One Source of Truth
One of the greatest advantages of BI dashboards is the ability to connect multiple departments using shared business data.
Instead of individual teams maintaining separate spreadsheets, everyone works from the same trusted information.
Executives gain enterprise-wide visibility across:
- Sales
- Finance
- Operations
- Customer Service
- Warehousing
- Transportation
- Branches
- Management
- Others
This leads to better collaboration and fewer conflicting reports.
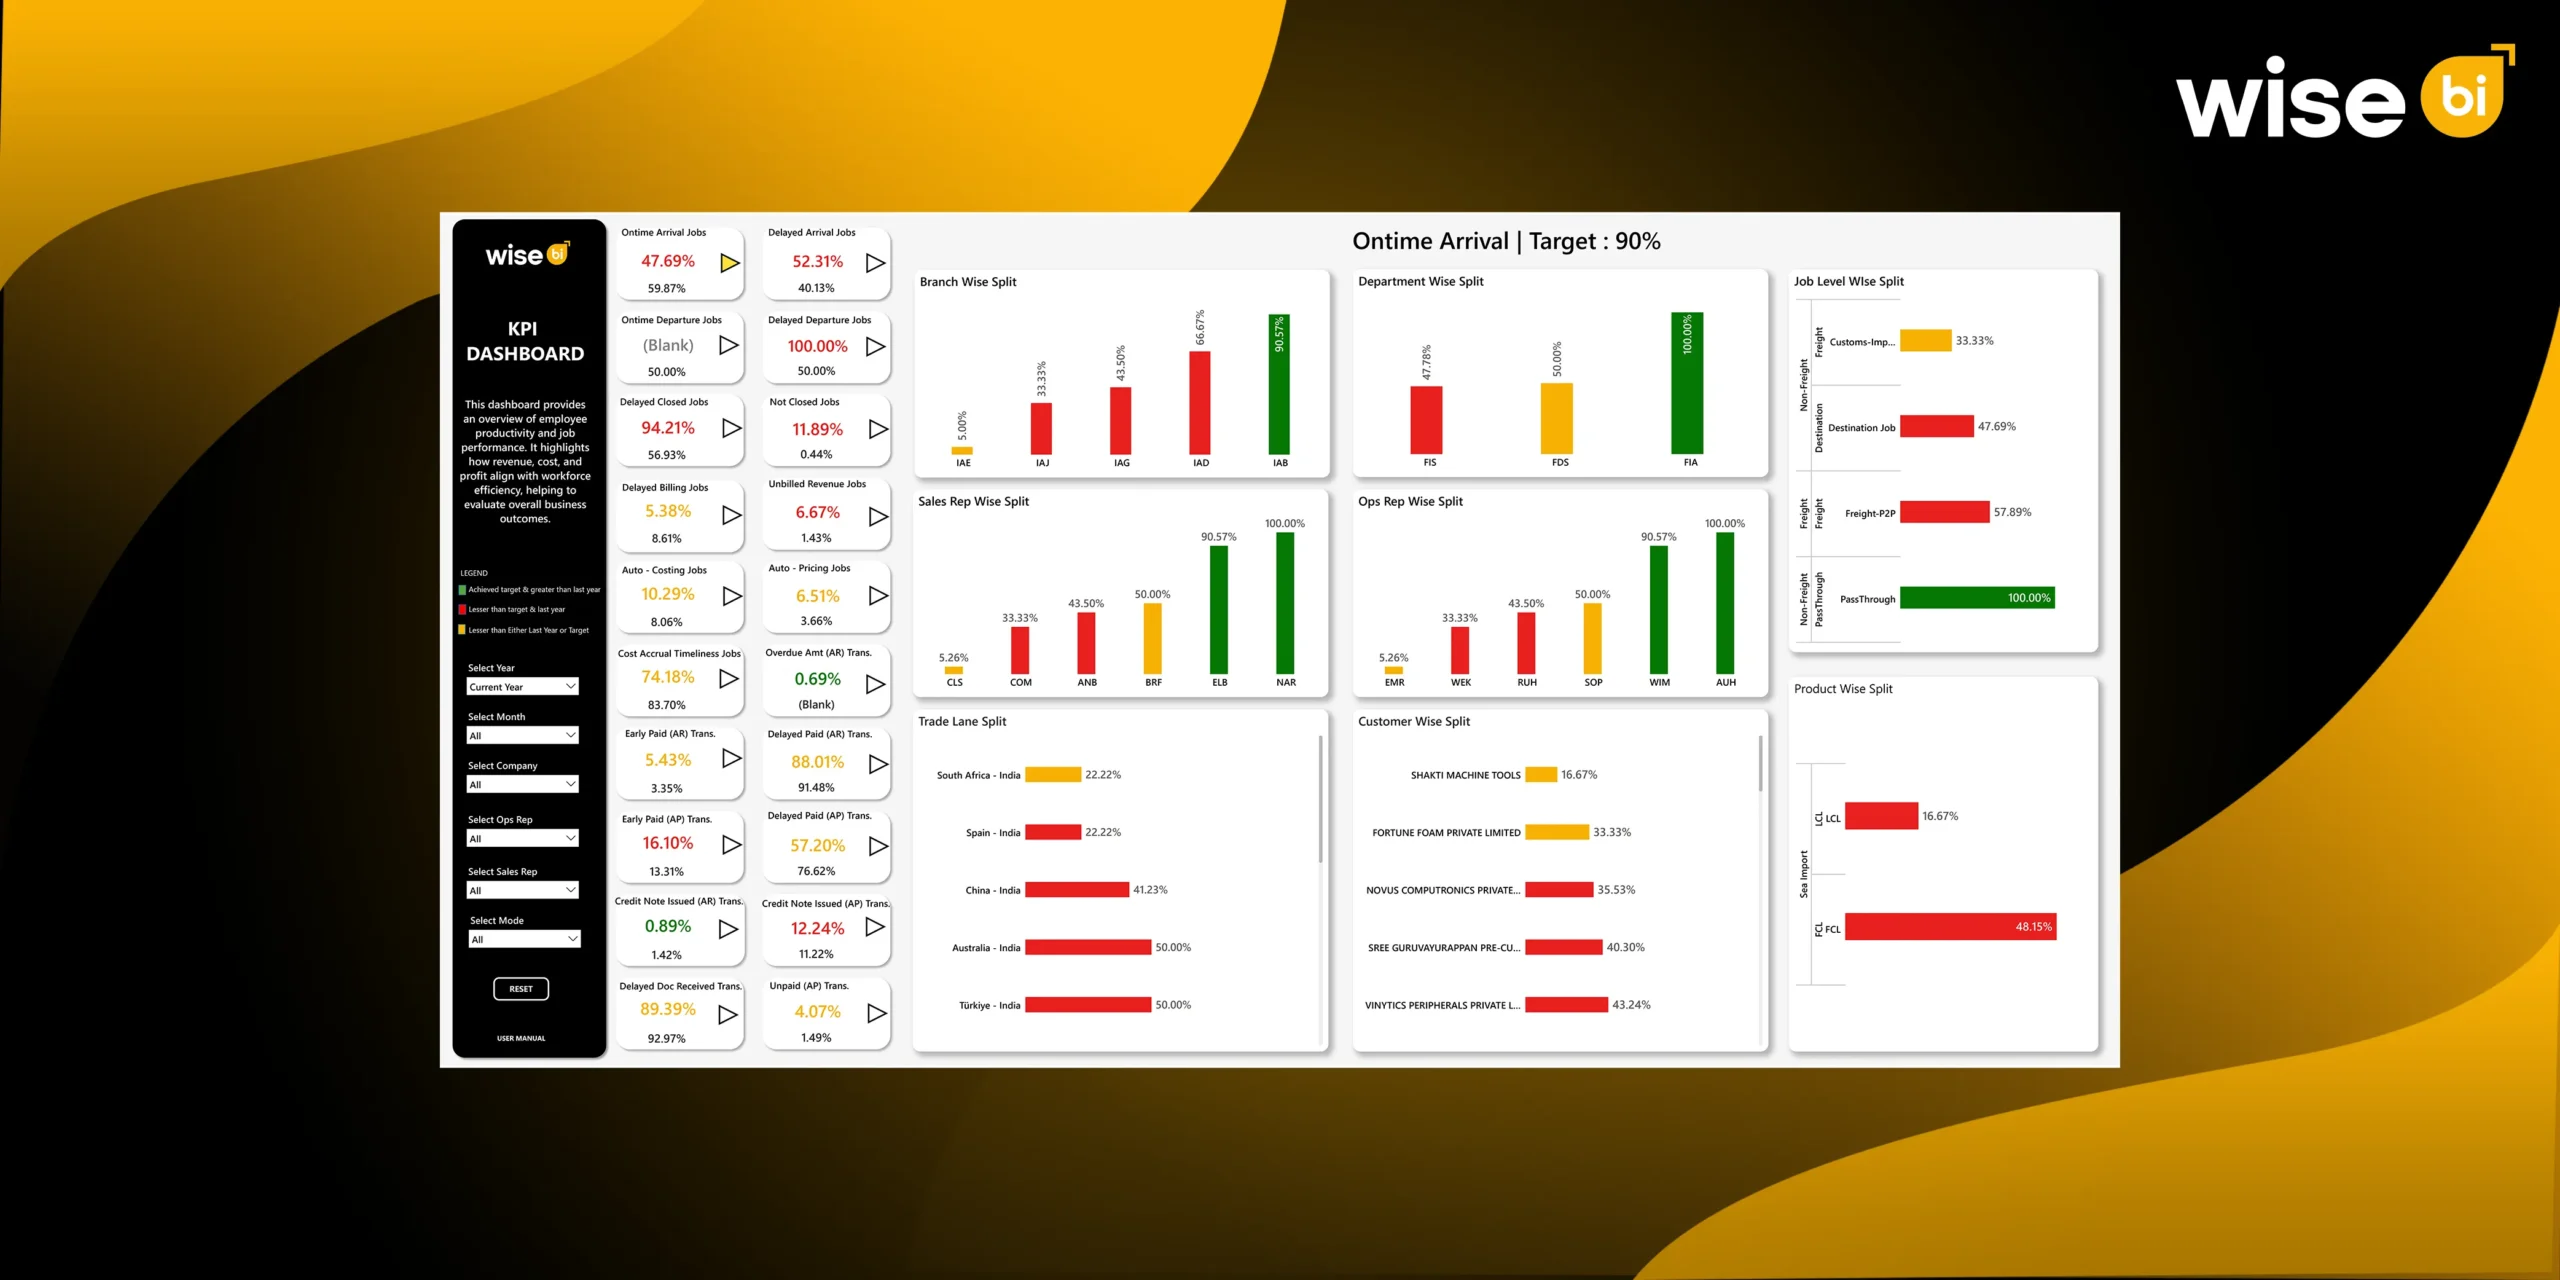
Key Logistics KPIs Every BI Dashboard Should Monitor
An effective logistics BI dashboard should monitor key performance indicators that directly impact operational efficiency and profitability, such as:
- Revenue per customer
- Gross profit per shipment
- Gross profit by trade lane
- Branch profitability
- Shipment volume
- Revenue by service
- On-time delivery performance
- Customer attrition and retention
- Outstanding receivables
- Cash flow
- Operating costs
- Warehouse operation
- Transportation costs
- Sales conversion rate
- Average shipment value
Tracking these metrics in one place enables leaders to identify opportunities more quickly and make informed business decisions.
Why are Modern Logistics Companies Investing in BI Implementation?
The logistics industry is becoming increasingly data-driven. Customers expect faster service, greater transparency, and competitive pricing, while businesses face rising transportation costs and tighter profit margins.
Companies that rely entirely on ERP reports frequently struggle to keep up with these demands.
Implement BI in logistics organizations to move beyond operational reporting by enabling predictive analytics, automated reporting, executive scorecards, and real-time performance monitoring.
Instead of simply understanding what happened, leadership teams gain the ability to anticipate trends, identify risks, and act before issues impact customers or profitability.
Conclusion
A logistics ERP is the operational backbone of a freight company, but its true value is realized when its data is transformed into useful business intelligence.
BI dashboards connect operational data to strategic decision-making by providing real-time visibility into sales, finance, operations, and customer performance. They eliminate manual reporting, improve collaboration, and allow businesses to identify trends, reduce costs, and increase profits.
As logistics operations become more complex and customer expectations rise, organizations that integrate their ERP with powerful BI dashboards will be better able to make faster decisions, improve operational efficiency, and build a more resilient, data-driven business.
Ready to get more value from your logistics ERP? Book a free demo with Wise BI today to see how the right BI dashboard can help you unlock the full potential of your logistics ERP.