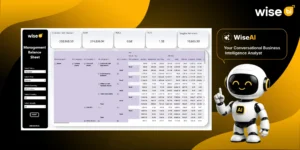
If you manage logistics operations, you know that having the right insights at the right time can make all the difference in decision-making. When it comes to global operations, understanding how each country is performing, in terms of both revenue and volume, is crucial. But how do you efficiently track and analyze performance across different regions without getting slowed down in endless reports or confusing spreadsheets?
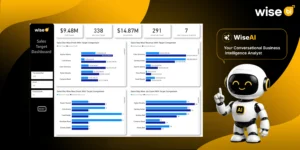
The answer lies in a Revenue and Volume Analysis Dashboard, which provides a comprehensive view of your shipment and financial performance at the country level. Whether you’re looking to track revenue trends, analyze shipment volume, or uncover underperforming regions, this powerful tool makes it all possible in a few clicks.
Understanding the Importance of Country-Specific Insights
When you’re managing operations across multiple countries, it’s easy to get lost in the noise of global data. You might be looking at high-level numbers, but do you know where your most profitable regions are? Or which markets are underperforming and need attention?
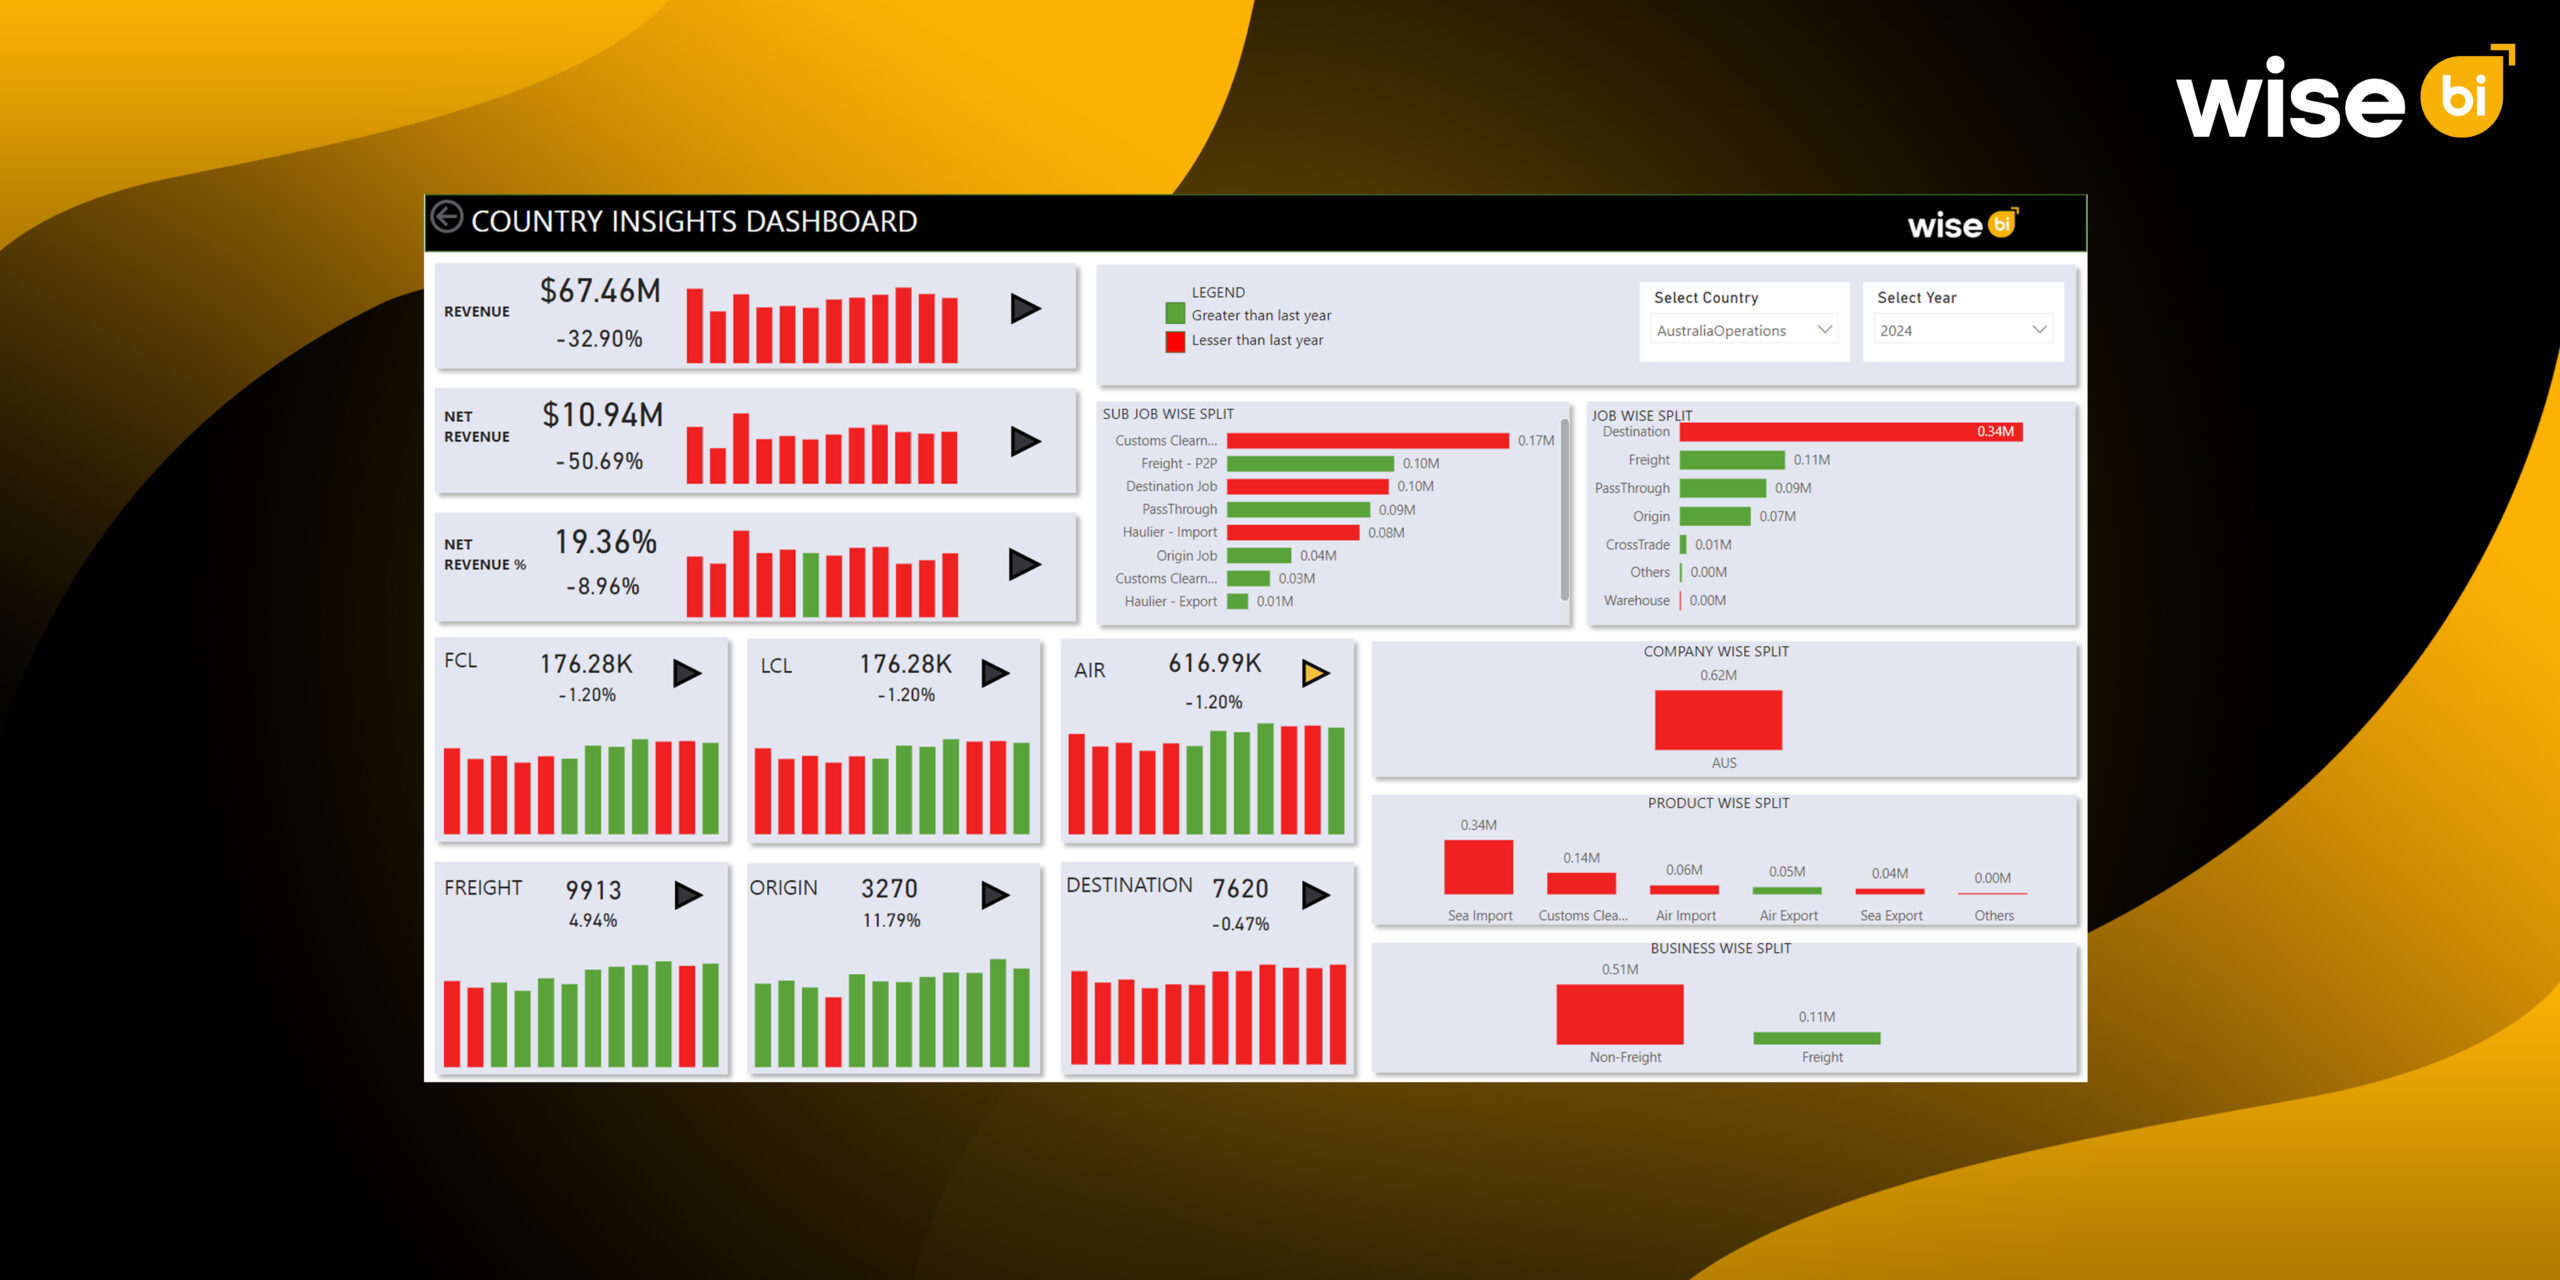
The Country Insights Dashboard offers a simple, yet powerful, way to track the revenue and shipment volume for each country, all in real-time. Regardless of your role, financial officer, regional director, or logistics manager, this tool lets you focus on the most important aspects while still seeing the wider picture.
By using this dashboard, you can:
- Track country-specific revenue trends: Know which countries are performing better than others and why.
- Analyze shipment volume by region: See where the bulk of your shipments are coming from and where improvements can be made.
- Identify key markets: Pinpoint which regions have the highest growth potential, allowing for smarter strategic planning.
Key Features of the Country Insights Dashboard
1. Track Revenue Trends by Country
- The revenue insights feature of this dashboard provides a detailed breakdown of your revenue performance by country, helping you to easily identify areas where revenue is increasing or decreasing.
- The dashboard displays revenue trends in a way that highlights both positive and negative changes compared to the previous year. You can quickly see whether each country’s revenue is growing or shrinking.
- By tracking these trends, you’ll be able to spot potential growth opportunities and areas that may need additional investment or attention.
- Revenue growth in specific countries can signal the need to expand operations, boost marketing efforts, or engage in partnerships. Conversely, regions with declining revenue may require new strategies, such as renegotiating contracts, optimizing pricing, or focusing on customer retention.
2. Monitor Shipment Volume by Country
- In addition to revenue, it’s essential to keep a close eye on shipment volume for each country. By doing so, you can ensure that you are meeting customer demands efficiently and making the most of your shipping resources.
- The dashboard provides a breakdown of shipment volume, giving you the ability to see both the total number of shipments and the volume by country.
- This allows you to understand shipping trends by region. Are there countries where you’re shipping a lot but not seeing high revenue? Or perhaps there are regions where shipment volume is low, but there’s potential to increase demand?
- Shipment volume is a key indicator of market demand. Low shipping volume in high-revenue countries could point to supply chain inefficiencies or missed opportunities to capture more market share. By identifying this, you can make operational adjustments to improve performance.
3. Identify Underperforming Regions
- The Country Insights Dashboard helps you identify underperforming regions by providing comparative insights into different markets.
- The dashboard highlights both positive and negative trends, allowing you to quickly spot regions that need attention. For instance, a region with consistently declining revenue or volume will show up with red indicators.
- You’ll be able to see which markets are lagging behind in terms of shipment volume or revenue generation.
- Spotting underperforming regions early gives you the chance to implement targeted strategies, such as optimizing routes, adjusting marketing, or engaging with local partners to boost performance.
4. Job Type and Service Split
- One of the more comprehensive features of the dashboard is the Job Type and Service Split, which allows you to see how different shipment types (like FCL, LCL, Air Freight) are performing across regions.
- This data is broken down by job category, helping you to track specific services and how they contribute to your overall performance.
- You can quickly identify which types of shipments are driving the most revenue and volume and which may require process improvements. For example, if air freight is performing well in a country while LCL shipments are lagging, you may need to investigate why.
- Having this level of detail helps you make strategic decisions about where to allocate resources, what services to focus on, and where to make improvements.
5. Product and Business Wing Split
- The dashboard also provides insight into how your business is performing across different product types and business segments.
- This feature allows you to see performance across product categories, such as sea import, LCL, or air freight, as well as a split between non-freight and freight revenue.
- Understanding these splits helps you evaluate which segments are most profitable and which may need more attention or optimization.
- By understanding where your most profitable segments lie, you can align your business strategies accordingly. For example, if LCL shipments are performing poorly, you may want to invest in more targeted marketing or better consolidation processes.
Conclusion
The Revenue and Volume Analysis Dashboard provides actionable insights into your revenue and shipment performance by country, helping you identify underperforming regions, track trends, and optimize your global operations. Whether you’re looking to boost shipments in a key market or improve underperforming areas, this dashboard provides the clarity and precision you need.
It’s time to use the Country Insights Dashboard’s capabilities if you’re prepared to advance your international business. Contact us today to see how we can help you gain a clearer view of your business performance and make smarter decisions based on real-time insights.