A logistics BI dashboard does not generate ROI solely because it looks good. It generates ROI by allowing your team to save time, control costs, protect margins, and make faster decisions.
Every delay, manual report, missed margin, late invoice, or underperforming customer in logistics costs money. The challenge is that many businesses do not see these costs clearly until they have already had an impact on profitability.
That is where a logistics BI dashboard becomes valuable.
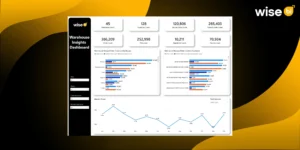
Instead of spending hours gathering data from spreadsheets, ERP reports, warehouse systems, transport updates, and finance files, your team can see operational and financial performance in a single connected dashboard.
The return on investment is derived from a simple shift: less time spent creating reports and more time spent improving performance.
What does ROI Mean for Logistics BI Dashboards?
ROI is the measurable value your company gains from using a BI dashboard compared to the cost of implementing it.
Logistics companies’ ROI is often not limited to direct cost savings. It can also be the result of improved visibility, faster reporting, better customer service, stronger margin control, and more informed leadership decisions.
A logistics BI dashboard can support ROI by helping your company.
- Reduce manual reporting time.
- Identify profit leakage earlier
- Improve shipment visibility
- Track branch and customer performance
- Monitor revenue, cost, and gross profit
- Reduce delays and operational bottlenecks
- Improve finance and cash flow visibility
- Support faster management decisions
Instead of simply displaying data, the value of the dashboard increases when it is linked to real business questions.
Where do Logistics Companies Lose Money Without Business Intelligence Visibility?
Many logistics companies already have the data they require, but it is frequently dispersed across ERP systems, warehouse systems, transportation updates, finance tools, and spreadsheets.
When teams manually combine these sources, reporting becomes inefficient and inconsistent.
This leads to hidden costs such as:
- Staff spending hours preparing reports
- Executives are waiting for updated numbers
- Different teams use different KPI definitions
- Delays are being noticed too late
- Low-margin customers staying unnoticed
- Cost increases are being identified after the month-end
- Leadership is making decisions without a complete view
These are the areas where BI dashboards begin to generate ROI.
Reducing Manual Reporting Time
Reducing manual reporting effort is one of the most efficient ways for a logistics BI dashboard to deliver value.
If your team spends several hours per week exporting data, updating spreadsheets, checking formulas, and preparing management reports, that time has a monetary value.
A BI dashboard can reduce the need for repeated reporting by automating data consolidation and presenting metrics in a reusable format.
Instead of rebuilding shipment, revenue, cost, and profit reports every month, your team can simply open a dashboard and view updated KPIs. This increases productivity because analysts, finance teams, and operations managers can spend more time interpreting data rather than preparing files.
Better Cost and Margin Control
Revenue growth in logistics does not always imply higher profitability.
A customer may have a high shipment volume but a low margin. A trade lane may appear to be active, but it actually has high operating costs. A warehouse process may result in hidden handling costs. A transportation partner may increase cost pressures over time.
A logistics BI dashboard helps your team compare revenue, cost, gross profit, and gross profit percentage across customers, branches, products, transport modes, and services.
This helps answer important questions:
- Which customers are profitable?
- Which services create weak margins?
- Where are costs rising?
- Which branches need review?
- Which trade lanes are underperforming?
When teams identify margin issues early on, they can adjust pricing, review cost allocation, renegotiate rates, or improve operational processes to prevent losses from growing.
Faster Decision-Making
Slow decisions in logistics cost money.
If shipment delays, rising costs, warehouse bottlenecks, or overdue invoices become apparent only after reports have been prepared, your team is already reacting late.
A BI dashboard helps leaders make better decisions by providing faster access to performance data. Executives can filter dashboards by branch, customer, product, transport mode, country, or time period rather than having someone prepare a report.
This allows teams to transition from “What happened?” to “What should we do next?”
Faster decisions can improve service levels, shorten escalation times, and allow teams to respond before minor issues become costly problems.
Better Shipment and Operational Visibility
Shipment performance is one of the most significant areas where BI dashboards can add value.
A dashboard can assist teams in tracking shipment counts, on-time performance, delays, transport mode activity, customer contributions, country-specific movement, and operational workload.
This visibility enables operations teams to identify bottlenecks faster.
For example, if delays in one branch or mode of transportation increase, managers can address the problem sooner. If a customer’s shipment volume is declining, sales teams can act before the account deteriorates further.
Stronger Finance Visibility
One of the biggest benefits of BI dashboards is that they give finance teams a single, connected view of revenue, costs, profit, receivables, payables, and cash flow.
This assists finance leaders in understanding where money comes in, where it goes out, and where financial risk is accumulating. Better financial visibility allows for more effective cash flow planning and reduces the likelihood of surprises during the month-end review.
How to Measure ROI from a Logistics BI Dashboard?
To calculate ROI, first identify where your business is currently losing time or money.
Track areas such as:
- Time spent preparing monthly management reports
- Number of manual spreadsheets used across departments
- Effort required to combine ERP, TMS, WMS, and finance data
- Time taken to identify low-margin customers, services, or trade lanes
- Cost leakage from missed charges, rework, detention, demurrage, or unrecovered costs
- Delay trends by branch, customer, carrier, or transport mode
- Time spent reconciling revenue, cost, gross profit, receivables, and payables
- Speed of producing branch, customer, and profitability reports for leadership
- Decisions were delayed because updated data was not available
- Manual follow-ups needed for shipment, vendor, or invoice payment updates
Compare the figures after implementing the BI dashboard.
The simple ROI formula is as follows:
ROI (%) = (Business Value Gained − Dashboard Investment) ÷ Dashboard Investment × 100
However, the true value is not solely in the formula. The dashboard helps create better business outcomes.
What Makes a Logistics BI Dashboard a Good Investment?
When a dashboard is designed around real-world logistics decisions, it generates a significant ROI.
It should not be overloaded with random graphs. It should address common questions that your teams ask on a daily basis.
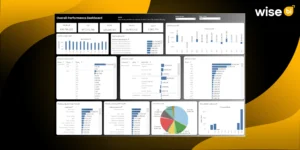
A strong logistics BI dashboard should include the following:
- One integrated view of your logistics business
- Real-time visibility throughout logistics operations
- Interactive performance monitoring
- Detailed business analysis
- Ability to integrate multiple systems into a single business intelligence platform
- Executive dashboards and KPI tracking
- Tools for identifying trends, risks, and growth opportunities
- Enhanced efficiency with interactive reporting
- Track revenue, costs, and profits
The most effective dashboards help all teams work smarter, including operations, finance, sales, customer service, warehouse, transportation, and leadership.
Conclusion
The ROI of a logistics BI dashboard comes from better visibility, faster reporting, stronger cost control, and smarter decisions.
When your team spends less time preparing spreadsheets and more time acting on insights, the business improves efficiency. When leaders can clearly see revenue, cost, profit, shipments, customers, branches, and financial risks, they can make more confident decisions.
In today’s logistics environment, data is everywhere. Companies that can quickly turn that data into action will have a significant advantage.
Want to know how BI dashboards can benefit your logistics business? Schedule a free demo with Wise BI to learn how logistics dashboards can help you reduce reporting effort, increase visibility, and make faster business decisions.