


CargoWise helps you manage complex logistics operations through a single platform. Whether you operate as a freight forwarder, customs broker, 3PL provider, or logistics company, CargoWise supports shipment management, customs clearance, warehousing, accounting, customer service, and other critical workflows.
As your business grows, however, the amount of data stored in CargoWise also increases. Every shipment, invoice, customs declaration, financial transaction, and customer interaction generates valuable business information.
The challenge is not collecting the data. The real challenge is transforming it into clear, timely, and actionable business insights.
Standard CargoWise reports are effective for monitoring your daily operations. However, as your logistics business grows, you may require greater flexibility, deeper analysis, and faster access to performance information. Business intelligence dashboards address these challenges by transforming CargoWise data into interactive reports, visual KPIs, and decision-ready insights.
Why is CargoWise Reporting Important?
CargoWise reporting involves more than reviewing completed transactions. It helps you understand how your business is performing, identify trends, monitor KPIs, and uncover areas that require improvement.
Accurate reporting helps you:
- Monitor shipment activity across branches
- Track revenue, costs, and gross profit
- Measure customer and supplier performance
- Review accounts receivable and payable
- Compare branch and company performance
- Support financial reconciliation and compliance
- Evaluate operational productivity
Without reliable reporting, you may struggle to identify rising costs, declining margins, low-performing branches, overdue receivables, or unprofitable customers before they affect your business performance.
Common CargoWise Reporting Challenges
CargoWise provides extensive reporting capabilities, but reporting can become more challenging as your operations, branch networks, and data volumes continue to expand.
Static Reports Provide Limited Insights
Standard CargoWise reports are effective at showing you what happened. However, they may not always explain why something happened.
For example, a report may show that your gross profit has declined. It may not clearly reveal whether the decline was caused by higher transportation costs, poor pricing, low-margin customers, or an underperforming branch.
You may need to review multiple reports before identifying the root cause. This slows your analysis and limits your ability to make timely business decisions.
Heavy Dependence on Excel
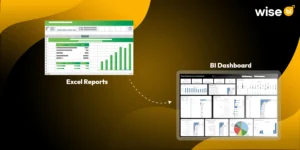
You may already be exporting CargoWise data into Excel to prepare weekly or monthly management reports.
Your finance teams may combine datasets, your operations teams may create summaries, and your analysts may build pivot tables, apply formulas, and create charts. This process consumes valuable time and introduces several reporting risks, including:
- Duplicate data
- Formula errors
- Inconsistent calculations
- Version control issues
- Delayed reporting
- Different KPI definitions across departments
Instead of analyzing performance, your teams may spend too much time preparing reports.
Limited Real-Time Visibility
Logistics decisions often need to be made quickly. Changing costs, overdue payments, shipment delays, and declining profit margins can affect your business performance immediately.
When your reports are generated only at scheduled intervals, you may have to rely on historical information. Operational and financial issues may only become visible after weekly reports are generated or month-end reporting is completed.
This delay reduces your ability to respond before a minor issue becomes a major business problem.
Data Silos Between Departments
CargoWise supports your finance, operations, customs, warehousing, transport, sales, and customer service teams. However, each department may prepare reports based only on its own responsibilities.
As a result, your shipment information, financial data, and customer performance may be analyzed separately.
One report can be used for shipment analysis, another for revenue, and a third for customer activity. It is difficult to understand how operational performance affects cash flow, profitability, and customer value without a comprehensive view.
Difficulty Tracking Business KPIs
As your logistics company grows, you may need to monitor several important KPIs, such as:
- Revenue and gross profit
- Gross profit percentage
- Shipment volume
- Revenue per shipment
- Customer profitability
- Branch performance
- Outstanding receivables
- Operational productivity
When these KPIs are distributed across multiple reports, performance monitoring becomes inefficient. You may also receive different versions of the same metric from different departments, making it difficult to establish a single source of truth.
That is why logistics businesses prefer BI dashboards for CargoWise Data to Decisions.
How do BI Dashboards Improve CargoWise Reporting?
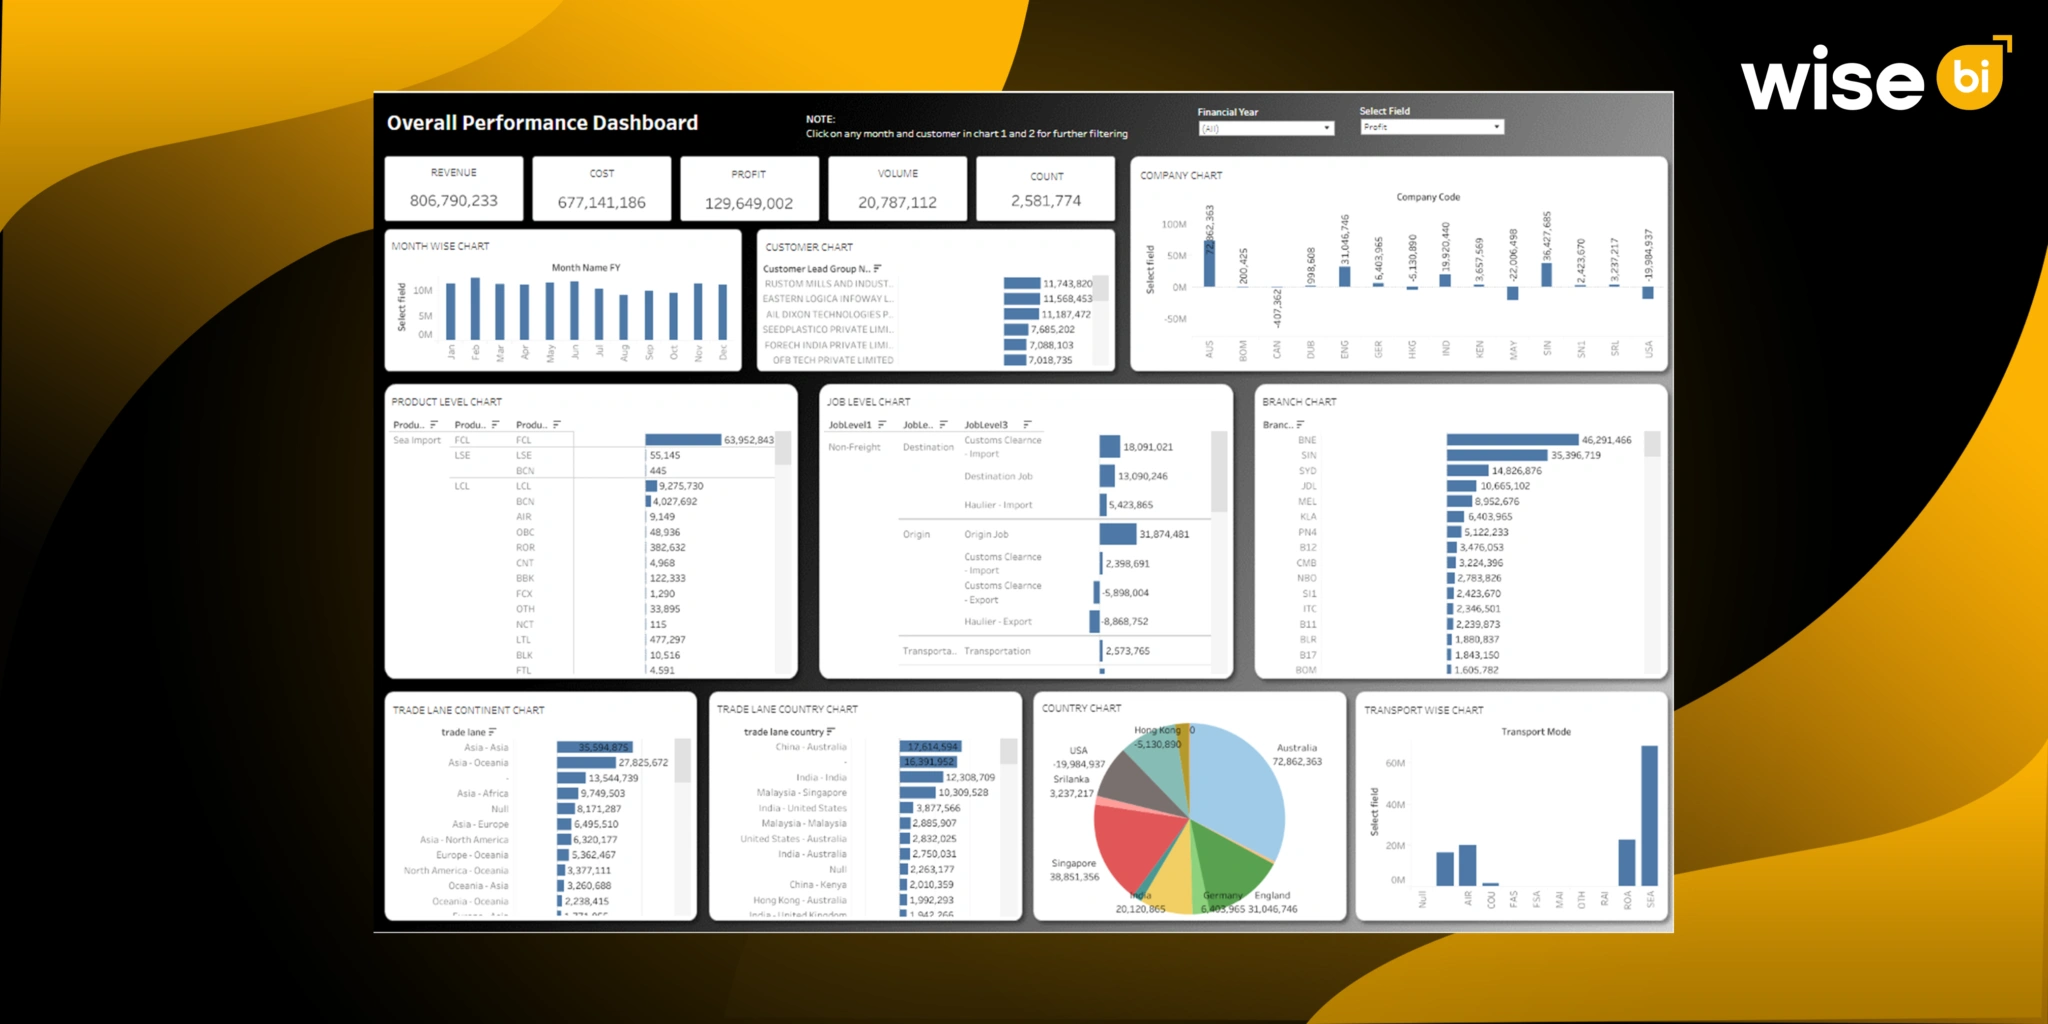
BI dashboards convert your CargoWise data into interactive visual reports that make business performance easier to understand.
Instead of opening multiple reports or manually combining spreadsheets, you can access a consolidated view of operational and financial information from a single dashboard.
Interactive Business Reporting
BI dashboards allow you to filter, sort, and drill down into information by:
- Branch
- Customer
- Shipment type
- Product
- Business unit
- Country
- Reporting period
This flexibility enables you to answer specific business questions without creating a new report every time.
Unified Business Visibility
BI dashboards combine your operational and financial information within a single reporting environment.
You can compare shipment growth with revenue, costs, and profitability. You can also determine whether increased shipment volumes are improving margins or simply increasing operational expenses.
This connected view strengthens collaboration between your finance, operations, sales, and management teams.
Automated Reporting
BI dashboards reduce repetitive manual reporting by automatically refreshing data and presenting updated KPIs.
Your teams no longer need to export the same data every week, rebuild spreadsheets, or manually update charts. Automation improves reporting consistency while allowing your employees to spend more time analyzing performance and identifying opportunities for improvement.
Faster Performance Monitoring
BI dashboards provide you with real-time visibility into operational activity, financial performance, customer trends, and outstanding issues.
Rather than waiting for monthly reports, you can identify problems earlier and take corrective action before they significantly affect your business performance.
Deeper Business Analysis
Interactive dashboards support drill-down analysis.
When your revenue declines, you can investigate the results by branch, customer, shipment type, or reporting period. When gross profit decreases, you can determine whether rising costs, pricing changes, customer mix, or operational inefficiencies contributed to the decline.
This transforms reporting from a historical activity into a practical decision-making tool for your business.
Business Benefits of BI Dashboards
Combining your CargoWise data with BI dashboards provides several operational and strategic benefits:
- Faster report generation
- Reduced dependence on spreadsheets
- Improved reporting accuracy
- Better visibility across departments
- Easier KPI monitoring
- Stronger financial analysis
- Clearer customer profitability insights
- Faster executive decision-making
- Better collaboration between finance and operations
- Greater confidence in business reporting
The goal is not simply to help you produce more reports. It is to help your teams understand business performance faster, identify opportunities sooner, and make better-informed decisions.
Why Choose WiseBI for CargoWise Reporting?
CargoWise provides the operational foundation, while WiseBI extends its value by transforming your ERP data into meaningful business intelligence.
WiseBI is purpose-built for logistics companies and delivers dashboards designed to meet your operational and financial reporting requirements.
Whether you are a freight forwarder, customs broker, 3PL provider, or supply chain organization, WiseBI helps you gain clearer visibility into your business performance.
Key capabilities include:
- Faster BI implementation, with up to 60% of reporting requirements available from day one
- Ready-to-use dashboards and reports based on proven logistics requirements
- No heavy CAPEX investment or high upfront implementation costs
- Flexible OPEX model based on the dashboards you need
- Built specifically for CargoWise users and workflows
- Role-based dashboards for executives, finance, operations, and sales teams
- Customize BI development aligned with your business requirements
- Smooth CargoWise integration for unified business visibility
- Scalable analytics for multi-branch and global logistics companies
- WiseAI-powered analytics for faster insight discovery
- Experienced team combining CargoWise knowledge with BI expertise
By combining your CargoWise data with purpose-built BI reporting, you can move from disconnected reports to a more accurate, timely, and actionable view of your business performance.
Meet WiseAI for Faster Decision-Making
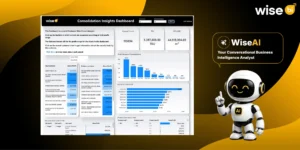
Our WiseAI is an intelligent, conversational AI business analyst that simplifies how you explore CargoWise data.
Instead of applying multiple filters or creating custom reports, you can ask business questions in natural language and receive clear answers through charts, tables, and visual insights.
WiseAI helps you:
- Ask questions in plain language
- Continue your analysis with follow-up questions
- Generate relevant charts and data tables
- Explore CargoWise data without technical reporting skills
- Access insights in multiple languages
- Maintain secure, read-only access based on user permissions
This increases the accessibility of business information for your finance, operations, sales, and leadership teams.
Conclusion
CargoWise plays a central role in managing your logistics operations. However, your reporting requirements become increasingly complex as your business grows.
Static reports, manual spreadsheets, data silos, and limited cross-functional visibility can prevent you from seeing the complete picture.
BI dashboards address these challenges by connecting your operational and financial data, automating repetitive reporting, improving KPI visibility, and supporting deeper business analysis.
For your logistics company, combining CargoWise with BI dashboards and WiseAI creates a more connected, efficient, and data-driven approach to business performance.
Schedule a free BI demo today and discover how your CargoWise data can help you make faster, smarter, and more confident business decisions.