


“Most decision makers are still making today’s decisions using yesterday’s information.” This challenge is magnified in freight forwarding, where shipment, quotation, customer, branch, revenue, cost, and accounting data are constantly accumulating across the business.
Although the necessary information may already be available, preparing MIS reports frequently entails extracting data, combining spreadsheets, verifying formulas, and gathering updates from multiple departments. BI dashboards make this process easier by organizing freight forwarding data into clear, frequently updated views that allow management to monitor performance, identify problems, and make informed decisions faster.
What is MIS Reporting in Freight Forwarding?
MIS stands for Management Information System. MIS reporting is the structured process of presenting important operational, financial, sales, customer, and workforce information to management.
The purpose of an MIS report is not simply to list transactions. It summarizes what happened, compares results with targets or previous periods, highlights exceptions, and shows leaders where attention is needed.
For a freight forwarding business, MIS reporting can help management answer questions such as:
- Did shipment volume increase while gross profit declined?
- Which branches, customers, or trade lanes generated the strongest margins?
- Are sales teams achieving their targets?
- How many quotations are being converted into shipments?
- Which jobs are producing low or negative profits?
- How much customer debt is overdue?
- Is workload distributed properly across employees?
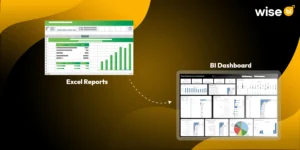
Traditional MIS reports can answer these questions. However, preparing them manually often requires repeated data extraction, spreadsheet consolidation, formula checks, and coordination between departments.
Why does Manual MIS Reporting Become Difficult?
Freight forwarding data is closely connected but often reported separately. Each shipment may be associated with a transport mode, customer, supplier, branch, salesperson, operator, revenue, cost, and profit.
Operations teams monitor shipments and jobs. Finance teams review invoices, costs, accruals, debtors, and creditors. Sales teams track quotations, targets, and customer activity. When each department prepares its own report, KPI definitions, reporting periods, and figures may not always match.
Management teams may then spend meetings verifying numbers instead of discussing performance. Copying and combining data also increases the possibility of errors. Multiple versions of the same spreadsheet may circulate, making it difficult to know which one contains the latest information.
Most importantly, manual reports can make it difficult to understand the relationship between operational activity and financial results.
How do BI Dashboards Simplify MIS Reporting?
Bring Connected Business Data Together
BI dashboards can organize CargoWise and other approved business data within a governed reporting model. Instead of reviewing separate shipment, finance, customer, and sales reports, management can compare related information through connected dashboard views.
This helps them determine whether the decrease may be connected to lower shipment activity, higher supplier costs, pricing pressure, customer changes, or a different service mix.
Reduce Repetitive Report Preparation
Preparing weekly or monthly MIS reports can involve performing the same tasks repeatedly. Employees may need to extract data, clean spreadsheets, update formulas, create charts, and combine reports from several teams.
Once data connections, KPI calculations, and refresh schedules are properly configured, BI dashboards can update recurring management views without rebuilding every report from the beginning.
Power BI supports scheduled semantic model refresh. However, the availability and timing of updated information depend on the selected connection method, system configuration, capacity, and source data. Data quality, access controls, and validation remain essential.
Standardize KPIs Across Departments
MIS reporting becomes difficult when different departments calculate the same KPI differently.
For example, one department may calculate shipment volume using created jobs, while another uses completed shipments. Sales and finance teams may also use different reporting periods when measuring revenue or customer performance.
A shared BI environment can standardize:
- Shipment volume
- Revenue
- Gross profit
- Gross profit percentage
- Quotation conversion
- Overdue receivables
- Job profitability
- Employee productivity
Executives can then compare performance across branches, teams, and reporting periods using the same measurement standards.
Allow Managers to Explore the Details
A static MIS report may show that a branch missed its monthly profit target. However, the report may not explain what caused the result.
Interactive BI dashboards allow authorized managers to move from a high-level figure to the supporting information. Microsoft describes drillthrough as the ability to navigate to a detailed report page that is automatically filtered to the selected context.
For example, management may follow this reporting path:
Company Performance → Branch → Customer → Shipment → Job Profit
This helps managers investigate which customers, shipments, charges, or activity changes influenced the overall result without waiting for another team to prepare a separate report.
Highlight Exceptions that Require Attention
Management does not need to review every shipment or transaction individually. A well-designed BI dashboard should direct attention toward unusual results, risks, trends, and performance gaps.
Dashboard indicators can highlight:
- Declining gross profit
- Loss-making jobs
- Missed sales targets
- Low quotation conversion
- Overdue customer balances
- Declining customer activity
- Unusual cost movements
- Uneven employee workload
However, a dashboard provides context rather than a final diagnosis. Low job profitability, for example, could result from an unrecorded accrual, an unexpected supplier charge, incomplete customer billing, incorrect data, or genuine commercial underperformance. Management should investigate the supporting information before acting.
Which BI Dashboards Support Freight Forwarding MIS Reporting?
The optimal combination of dashboards varies based on a company’s structure, reporting priorities, and management responsibilities. However, certain dashboards are especially pertinent to an MIS reporting framework.
Profit and Loss Dashboard
A profit and loss dashboard supports management-level financial reviews by presenting revenue, expenses, and profitability across selected periods and business areas.
Shipment and Volume Analysis Dashboards
Shipment analysis and volume analysis dashboards help management compare operational activity across customers, branches, transport modes, and reporting periods.
Customer Analysis Dashboard
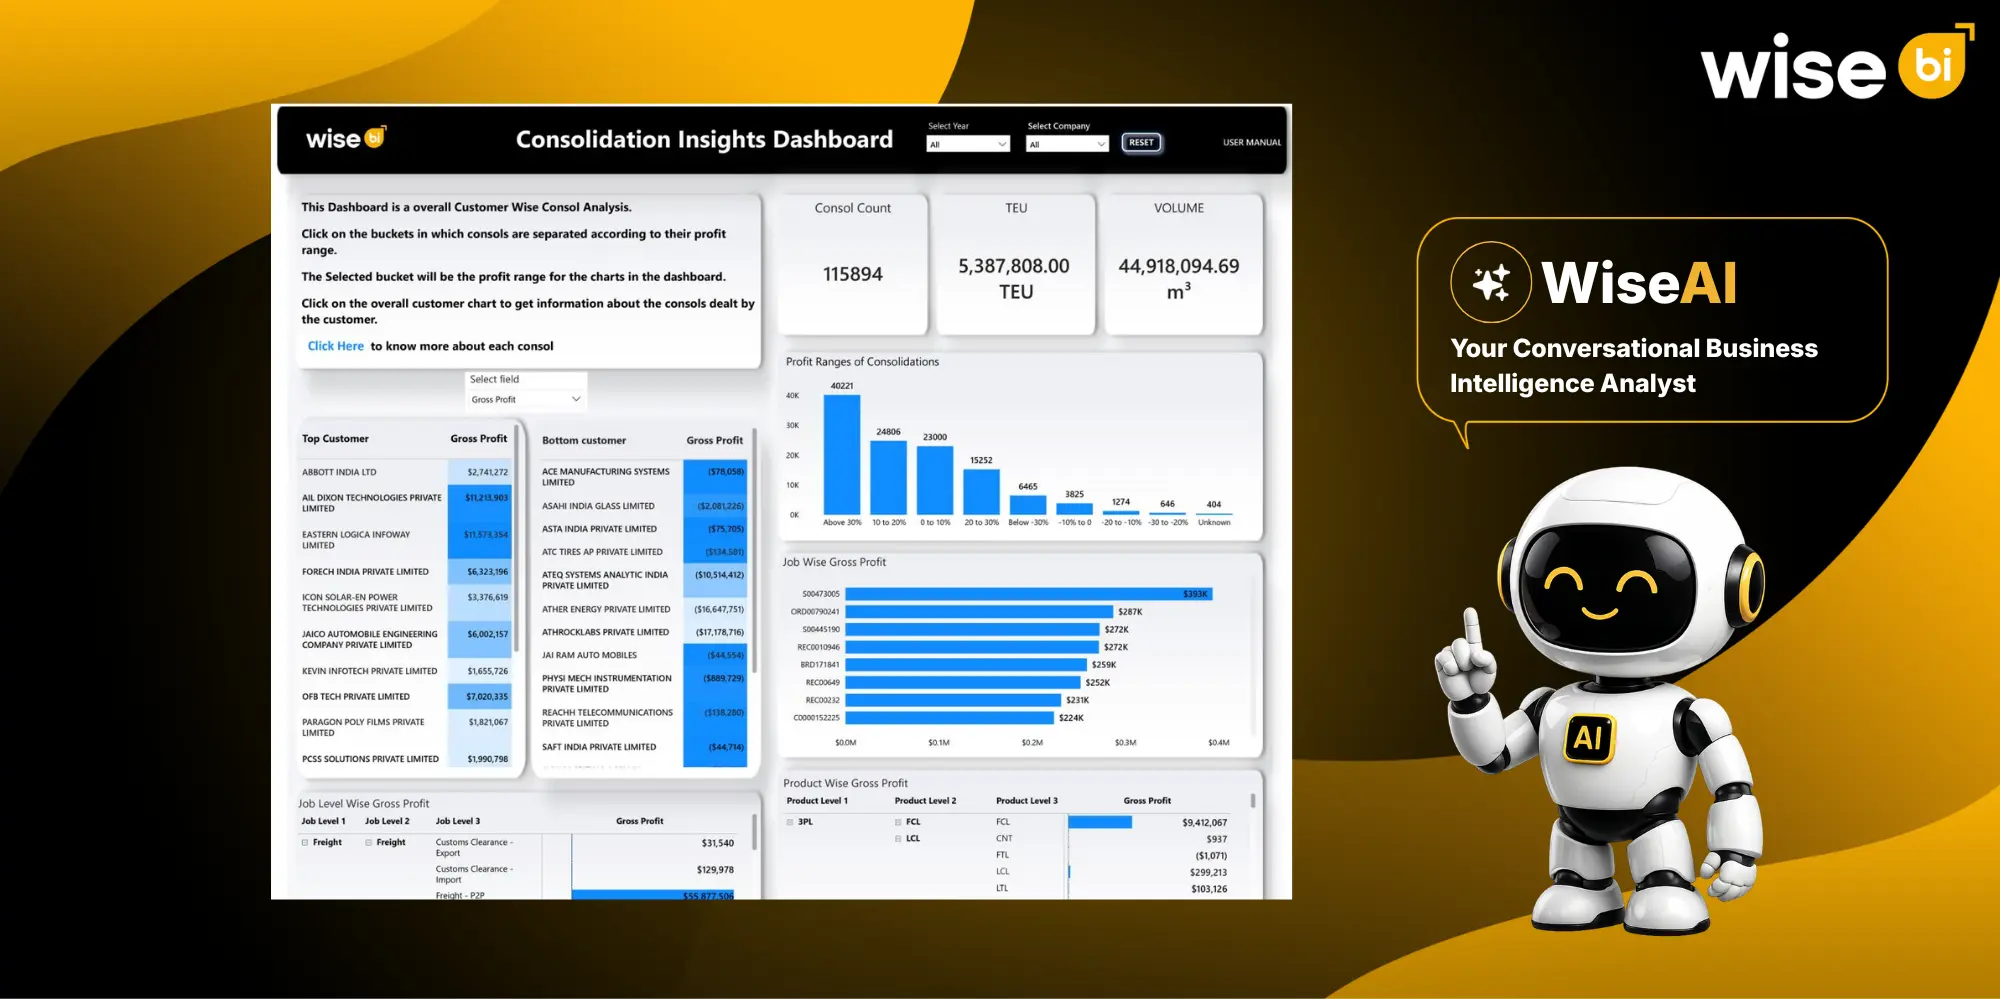
A customer analysis dashboard helps management review customer revenue, shipment activity, profitability, retention, and changes in business contribution.
Branch Insights Dashboard
A branch insights dashboard lets senior management compare shipment activity, revenue, costs, and profitability across business locations.
Debtor Dashboard
A debtor dashboard presents outstanding receivables, overdue invoices, aging categories, and customer-level balances. This helps finance and management teams identify collection risks.
These dashboards should operate as connected management views rather than isolated charts. Leadership should be able to move logically from overall performance to the branch, customer, shipment, or job that requires attention.
How can WiseBI’s Conversational BI Support MIS Analysis?
Dashboards answer recurring management questions visually. However, users may also need quick answers to follow-up questions that are not immediately visible on the screen.
Conversational BI can complement dashboards by allowing authorized users to ask natural-language questions such as:
- Which customers produced lower gross profit this quarter?
- Which branch has the highest overdue debt?
- Which trade lanes experienced declining shipment volume?
- Which jobs generated negative margins last month?
WiseBI offers an AI-powered business intelligence layer that simplifies exploring freight forwarding data through enhanced dashboards and conversational analysis. This enables freight forwarders to examine approved business measures without the need to navigate multiple report pages. The quality of each response relies on data, the reporting model, user permissions, KPI definitions, and the governance process.
Conclusion
BI dashboards make MIS reporting more useful by moving freight forwarders beyond manually prepared summaries. Managers can review connected operational and financial performance, identify exceptions, and investigate the shipments, customers, branches, or jobs behind the results.
Effective MIS reporting should focus on the questions management needs to answer, not on displaying every available KPI. Clear definitions, reliable source data, appropriate access controls, and KPI ownership are essential for producing trustworthy insights.
Ready to simplify your MIS reporting? Book a free demo with WiseBI today to discover the dashboards that fit your freight forwarding business.