A customer can generate a lot of jobs and still deliver weaker financial value than expected.
That is why freight forwarders need to look beyond shipment activity and revenue alone. A high-volume account may create a significant operational workload, while a smaller customer may generate stronger margins and better gross profit.
For CargoWise users, the challenge is not a lack of customer data. It is about understanding which customers are truly profitable, which accounts are losing momentum, and where commercial attention is needed.
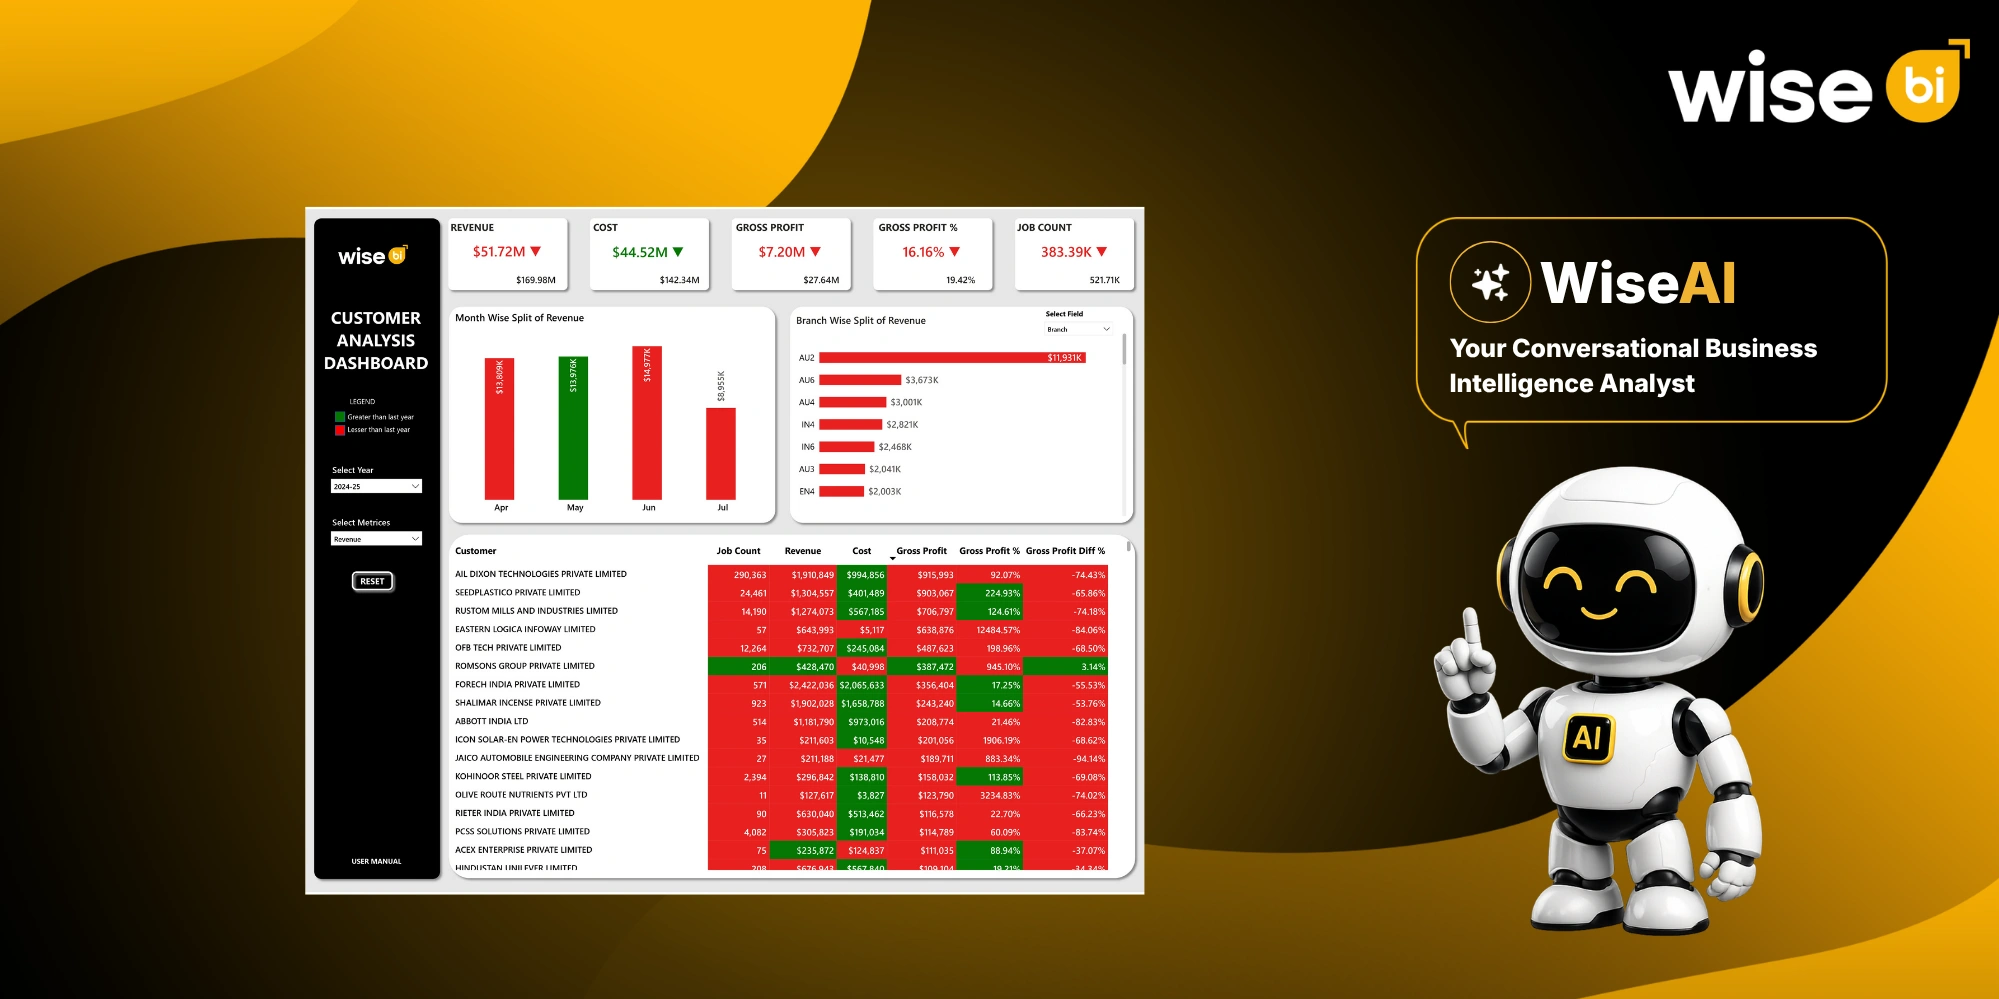
A CargoWise Customer Analysis Dashboard brings the key customer KPIs together, including revenue, cost, gross profit, gross profit %, job count, gross profit difference %, monthly trends, branch performance, and customer-level comparisons. It also supports analysis by country, company, branch, department, product, and job.
That gives freight forwarders a much clearer answer to one important question:
Which customers are creating sustainable business value?
Why is Customer Profitability More Important than Revenue Alone?
Revenue tells you how much business a customer generates. It does not tell you what remains after the cost of serving that customer.
A high-revenue account may also involve higher freight costs, handling, documentation, support, billing effort, and operational coordination.
That means customer value should be judged across several KPIs, not one number.
A useful customer profitability review should ask:
- How much revenue does the customer generate?
- What does it cost to serve the account?
- What gross profit remains?
- Is the margin healthy?
- Is profitability improving or declining?
- How much operational workload does the customer create?
That is where CargoWise customer profitability analysis becomes useful.
Job Count: Understand the Workload Behind Each Customer
Job Count shows how much operational activity is connected to each customer.
This matters because two customers with similar revenue may create very different workloads.
A higher job count can mean more bookings, documentation, tracking, invoicing, coordination, and customer communication.
If Job Count rises while Gross Profit remains flat, the account may be creating more work without a similar increase in financial return.
This helps freight forwarders move from:
“Which customers give us the most work?”
to:
“Which customers make that workload commercially worthwhile?”
Revenue: See Which Customers Drive the Top Line
Revenue shows how much income each customer contributes.
It is an important starting point because it helps identify major accounts and understand where sales are concentrated.
The BI dashboard also supports monthly revenue analysis, helping teams see whether customer revenue is growing, declining, or fluctuating across reporting periods.
Revenue is useful, but it becomes far more meaningful when compared with cost and gross profit.
Cost: See What it Takes to Serve the Account
Cost shows the expense associated with each customer.
This helps finance and commercial teams understand whether the economics of an account are changing.
A customer may generate strong revenue but still produce weaker financial value if the cost of servicing that business is also high.
Cost visibility helps answer:
- Are customer costs increasing?
- Is cost rising faster than revenue?
- Which accounts are becoming more expensive to serve?
- Where should pricing or service scope be reviewed?
This is one of the most important checks before deciding whether a high-revenue customer is actually profitable.
Gross Profit: Identify Customers Creating Real Financial Value
Gross profit shows the financial contribution remaining after costs.
For freight forwarders, this is one of the most important customer KPIs.
The customer analysis dashboard compares gross profit directly with job count, revenue, and cost at the customer level.
This helps teams identify:
- High-revenue customers with strong gross profit
- High-revenue accounts with weaker profit
- Lower-volume customers with healthy financial contribution
- Accounts that need closer commercial review
The key takeaway is simple:
Your biggest customer is not always your most profitable customer.
Gross Profit %: Compare Margin Quality
Gross profit tells you the amount of profit generated. Gross Profit % shows margin quality.
This makes it easier to compare customers of different sizes.
Two accounts may produce similar gross profit, but one may require significantly more revenue to generate it.
Gross Profit % helps commercial and finance teams understand how efficiently each customer contributes profit. When combined with revenue history, job activity, and the overall customer relationship, it can also support Customer LTV analysis by helping freight forwarders identify which accounts may deliver stronger long-term commercial value.
Gross Profit Difference %: Spot Declining Customer Performance
The dashboard also includes Gross Profit Difference %, which compares profitability against a previous period.
This is valuable because a customer can still be profitable today while showing a clear downward trend.
A declining Gross Profit Difference % may indicate that an account needs attention before profitability deteriorates further.
It helps identify:
- Customers are improving over time
- Accounts with declining profit performance
- Relationships that may need pricing or service review
- Customers whose current results differ significantly from their earlier performance
When declining profitability is considered alongside changes in revenue and job activity, teams can look into potential customer attrition analysis signals and identify accounts that may be losing traction.
This makes customer profitability analysis more proactive and highlights the benefits of the customer analysis dashboard for CargoWise users by helping teams identify declining performance earlier and focus attention on the right accounts.
Compare Customer Profitability Across Business Dimensions
Customer profitability becomes more useful when teams can see where that performance is coming from.
The dashboard supports parameter-based analysis across:
- Country
- Company
- Branch
- Department
- Product
- Job
Users can then analyze selected metrics such as revenue, cost, gross profit, and gross profit %.
This helps freight forwarders move from broad questions such as “Which branches generate the most profit?” to more specific ones such as “Which customers are driving that branch’s performance?”
The first chart provides a high-level comparison, while the second chart drills into customer-level contribution for the selected segment.
That makes the dashboard useful for both management-level review and deeper commercial analysis.
Use Trend Indicators to Spot Changes Faster
The dashboard also uses visual indicators to compare current performance with the previous year.
According to the user guide:
- Green indicates an increase versus the previous year
- Red indicates a decrease versus the previous year
This allows teams to quickly identify positive or negative changes without manually comparing each figure. When combined with Gross Profit Difference%, these indicators make it easier to identify accounts that are improving and those that may require further review.
Explore Customer Performance with Filters and Conversational BI
Customer profitability should not be reviewed only at the total-company level. The BI dashboard allows users to narrow the analysis by year, month, company, customer, branch, and department, helping teams focus on the most relevant part of the business.
We further enhance the dashboard experience with AI-powered business intelligence. Users can ask which customers generated the strongest gross profit, which accounts show declining profitability, which branches contribute the most revenue, or which high-job-count customers have weaker margins.
Follow-up questions can then refine the analysis by customer, branch, company, department, or reporting period.
This combination of interactive filters and conversational BI makes CargoWise customer data easier to explore, helping commercial, finance, operations, and management teams move from a broad performance view to the specific account or business area that needs attention.
Turn Customer KPIs into Regular Account Reviews
The BI dashboard is most useful when it becomes part of an ongoing commercial process, not something opened only when a problem appears.
WiseBI’s customer analysis dashboard supports regular monitoring, customer segmentation, cross-functional collaboration, and keeping filters aligned with the analysis being performed.
For freight forwarders, that means teams can regularly identify customers with declining profit, rising costs, weakening margins, or changing job activity and bring those insights into sales, finance, and operations discussions earlier.
This helps turn customer analytics into action.
Conclusion
Customer profitability analysis helps freight forwarders understand more than just who generates the most revenue.
The CargoWise Customer Analysis Dashboard connects job count, revenue, cost, gross profit, gross profit %, gross profit difference %, trend indicators, business-dimension analysis, filters, and customer-level comparisons in one view.
That helps teams identify valuable customers, spot declining profitability, understand workload, and focus commercial attention where it matters most.
Schedule a free demo with WiseBI to see how your commercial, finance, operations, management, and BI teams can analyze CargoWise customer profitability and make stronger account decisions.