


Every day, logistics companies that use CargoWise generate massive amounts of operational and financial information. Every shipment, customer transaction, revenue entry, operational cost, branch activity, and financial record adds new data to the system.
However, having more CargoWise data does not guarantee improved business visibility.
Can you quickly identify your most profitable clients? What branches are underperforming? Where are costs rising? Or, why do higher shipment volumes not translate into higher margins?
This is where many logistics companies encounter difficulties. The data is already in CargoWise, but turning it into clear, actionable business insights may necessitate additional analysis.
By integrating CargoWise data with BI, logistics companies can go beyond operational reporting to gain a better understanding of business performance.
Why is CargoWise ERP Data Important for Logistics Companies?
CargoWise facilitates many of the day-to-day activities associated with logistics operations, generating valuable data across various areas of the business.
This can include information such as:
- Freight operations
- Shipment activity
- Customers
- Revenue and costs
- Accounts receivable and payable
- Branch and country performance
- Financial performance
Every transaction adds to a growing collection of business data.
However, the true value of CargoWise data derives from more than just its collection. The value stems from comprehending what that data says about business performance.
Shipping data can reveal volume trends. Customer data can be used to identify profitable patterns. Financial data can reveal changes in revenue, expenses, and receivables. Branch-level data allows management to compare performance across locations.
When properly analyzed, CargoWise ERP data can be an invaluable resource for making better business decisions.
Why is it Difficult to Turn CargoWise Data into Business Insights?
The majority of logistics companies do not suffer from a lack of data. The challenge is to make the data easy to analyze and utilize.
CargoWise enables operational transactions in a wide range of logistics contexts. As shipment volumes, customers, branches, and financial activity grow, so does the amount of data needed for management review.
Several challenges can complicate analysis.
Business Data May Exist Across Different Sources
CargoWise may store your core logistics and operational data, but additional business data may exist in CRM systems, spreadsheets, finance applications, warehouse tools, or other platforms.
When this data is analyzed separately, obtaining a comprehensive picture of business performance becomes more difficult.
Standard Reports May Not Answer Every Business Question
CargoWise operational reports can provide useful information about what happened over a specific time period.
However, understanding why performance changed may necessitate further investigation.
Before drawing any conclusions, teams may need to compare multiple reports, apply filters, export data, or manually combine information.
This can lead to slower decision-making.
Manual Reporting Takes Valuable Time
Finance teams, managers, and analysts can spend a significant amount of time extracting CargoWise data, preparing spreadsheets, updating calculations, and producing management reports.
The more time teams spend preparing information, the less time they have to analyze the results’ implications for the business.
Decision-Makers Need to Explore Data Further
One report may answer one question but immediately raise another.
- Why did the gross profit fall?
- Which customers contributed to the decline?
- Did one branch perform differently?
- Were costs higher for a particular service or shipment type?
Without interactive analytics, answering each additional question may necessitate a separate report or manual investigation.
How Can Logistics Companies Transform CargoWise Data Into Actionable Insights?
Turning CargoWise ERP data into actionable insights requires more than just creating new reports.
Logistics companies require a structured approach to connecting, organizing, visualizing, and analyzing the information that is already available throughout the organization.
This is where CargoWise BI dashboards can be useful.
Create a Unified View of CargoWise and Business Data
The first step is gathering relevant information.
CargoWise data, as well as data from other relevant sources, can be organized in a centralized analytical environment using business intelligence solutions.
Instead of reviewing shipment, financial, customer, and operational data separately, decision-makers can examine performance from a unified business perspective.
This reduces reliance on disconnected spreadsheets and makes it easier to compare data from various areas of the organization.
Transform CargoWise Data into Interactive BI Dashboards
Large tables and operational reports can make it difficult to identify key patterns quickly.
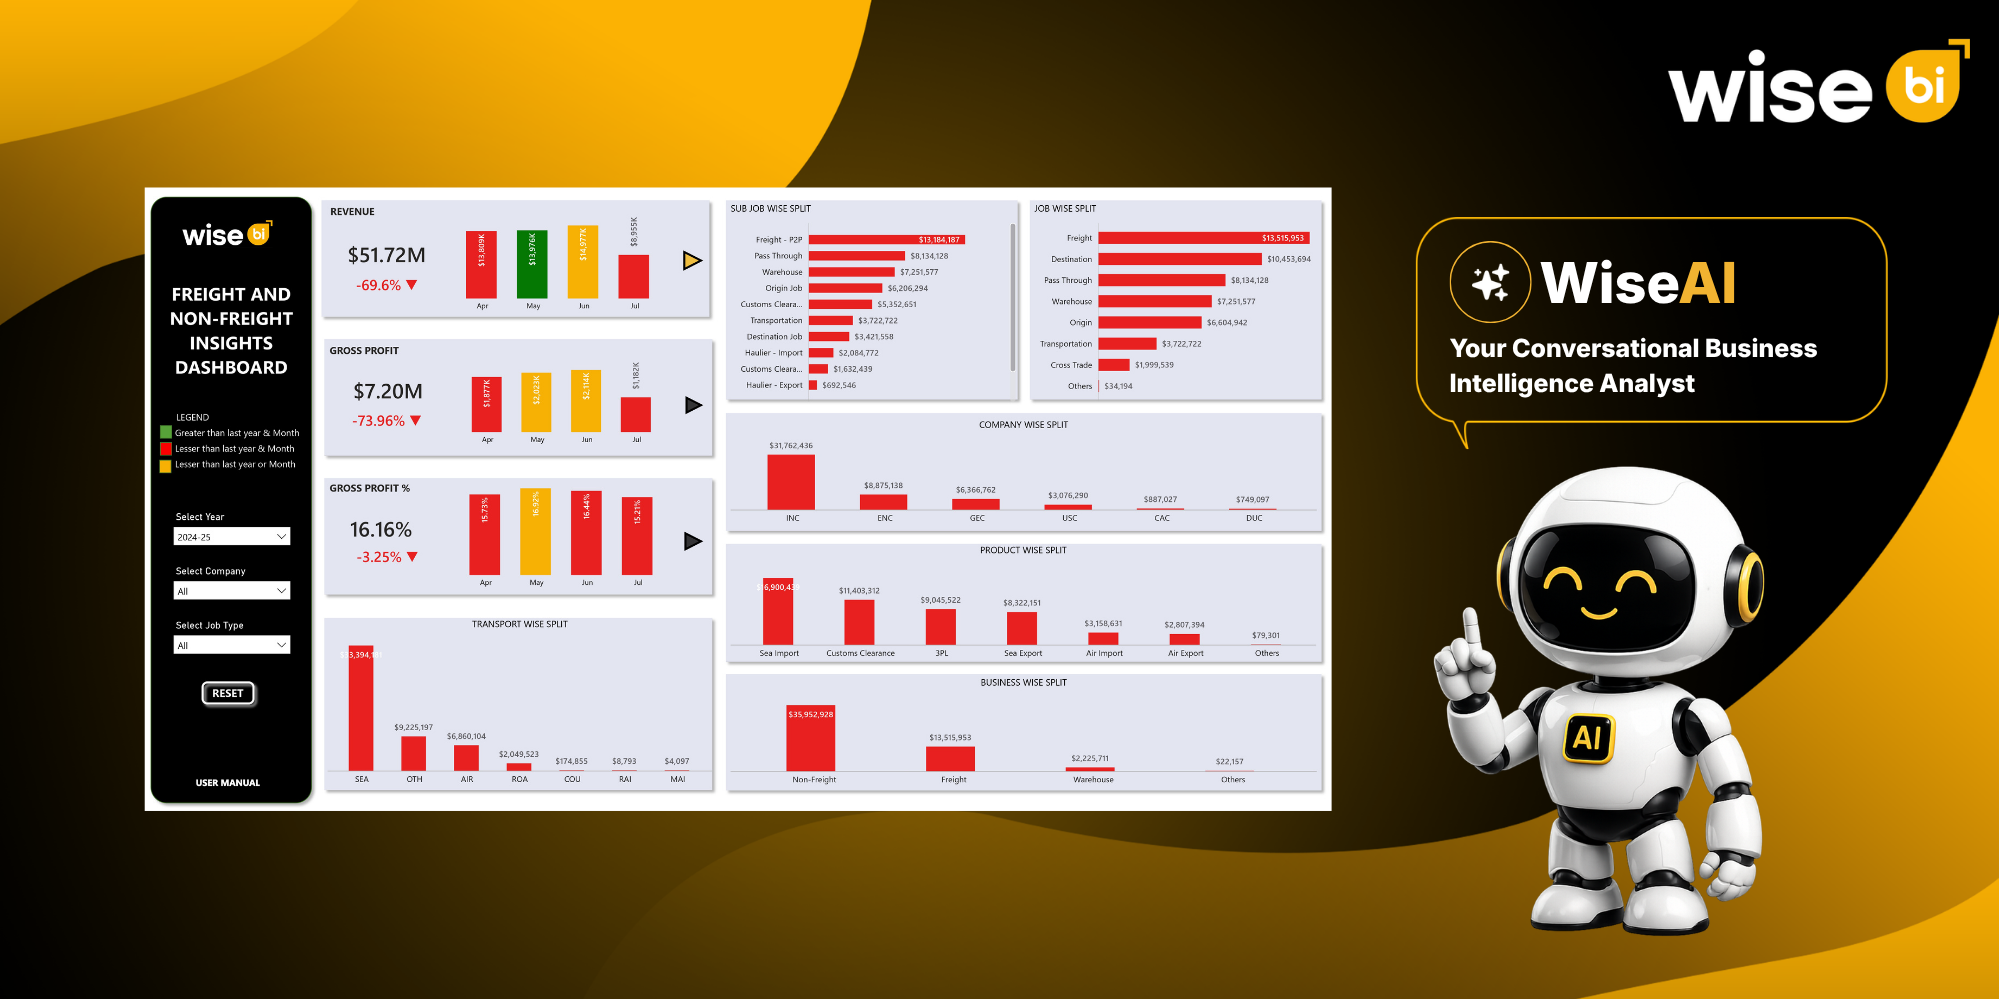
BI dashboards present CargoWise data as charts, KPIs, tables, and visual performance indicators.
Dashboards can help logistics leaders monitor areas such as:
- Revenue and profitability
- Shipment and volume trends
- Customer performance
- Branch and country performance
- Product or service performance
- Accounts receivable and payable
- Overall financial performance
Instead of going through rows of transactional data, management can identify patterns and performance changes faster.
Understand What is Driving Business Performance
Knowing what happened is helpful. Understanding why something happened is more important.
For example, suppose revenue rises while overall profitability remains constant.
A high-level report may include both figures, but an interactive CargoWise BI dashboard enables management to dig deeper.
The analysis may reveal that one branch generated more revenue while also incurring higher operational costs. Another possibility is that shipment volumes have increased for customers or services with low margins.
Instead of relying solely on headline numbers, this in-depth analysis assists decision-makers in understanding the factors that drive overall performance.
Monitor the CargoWise KPIs That Matter Most
Not all metrics require the same level of attention.
Logistics companies should focus on KPIs that support their operational and financial goals.
Depending on the business, these may include:
- Gross profit
- Profit margin
- Revenue per shipment
- Cost per shipment
- Customer profitability
- Shipment volume
- Branch performance
- Country performance
- Outstanding receivables
- Revenue and cost trends
WiseBI’s CargoWise KPI dashboard can consolidate these measurements into a single view, allowing management to track performance and investigate significant changes.
Identify Performance Issues Earlier
Improved visibility can also help logistics companies identify potential problems earlier.
CargoWise analytics can identify areas such as:
- Declining customer profitability
- Rising operational costs
- Underperforming branches
- Changes in shipment volumes
- Increasing outstanding receivables
- Unusual revenue or cost movements
When these changes are easier to detect, teams can investigate the underlying causes sooner.
This enables management to respond based on performance trends rather than waiting for the end of a reporting period.
Make CargoWise Insights Accessible to Decision-Makers
Business intelligence should not be restricted to analysts and technical teams.
Executives, finance leaders, branch managers, sales teams, and operations leaders require access to information relevant to their roles.
Users can analyze information using AI-powered CargoWise BI dashboards, which include filters, drill-downs, and visual comparisons, as well as AI support to analyze the company’s overall performance more easily.
For example, performance can be analyzed by:
- Month or year
- Branch
- Country
- Customer
- Product or service
- Currency
- Shipment type
This makes it easier for decision-makers to explore the information behind a KPI without relying on a separately prepared report for every new question.
Move from CargoWise Reporting to Data-Driven Decision-Making
Traditional reporting is often focused on showing what has already happened.
Business intelligence takes CargoWise data further by helping logistics companies compare performance, identify trends, investigate changes, and understand where management attention is needed.
For example, logistics leaders can use CargoWise analytics to ask:
- Which customers generate the strongest margins?
- Which branches require closer attention?
- Where are operational costs increasing?
- Which products or services contribute the most profit?
- How are shipment volumes changing?
- Which areas of the business are influencing overall profitability?
When these insights are easily accessible, CargoWise data becomes part of everyday decision-making rather than information reviewed only during monthly or quarterly reporting.
What Business Benefits can Logistics Companies Get From CargoWise Analytics?
Turning CargoWise ERP data into actionable insights can improve visibility across several areas of the organization.
Decision-makers can access business performance more quickly without waiting for manually prepared reports. Automated dashboards can reduce repetitive reporting work and give teams more time to analyze results.
CargoWise analytics can also make it easier to identify profitable customers, compare branches, monitor operational costs, track revenue and margins, and understand financial performance.
Most importantly, logistics companies can make decisions using connected business information rather than relying on assumptions or fragmented spreadsheets.
Conclusion
CargoWise already contains valuable information about logistics operations, customers, shipments, finances, and overall business performance. The challenge is turning that information into insights that decision-makers can easily understand and use.
WiseBI’s CargoWise BI dashboards help organize ERP data into clear visual insights, allowing logistics companies to monitor KPIs, investigate performance changes, identify opportunities, and make more informed business decisions.
Instead of spending hours searching through reports and spreadsheets, teams can focus more attention on what the data is telling them and how they can use those insights to improve business performance.
Ready to turn your CargoWise ERP data into clearer business insights? Schedule a free demo with WiseBI and see how CargoWise BI dashboards can help your logistics business make faster, more data-driven decisions.